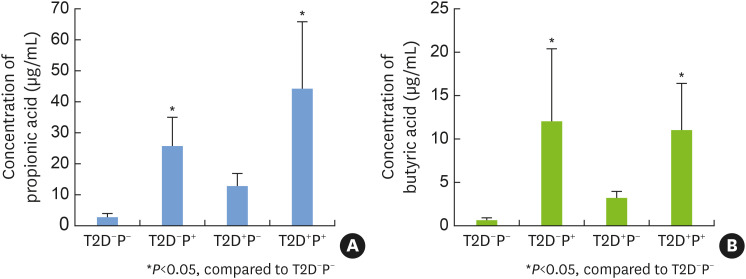
Figure 4. The concentrations of propionic acid and butyric acid in gingival crevicular fluid samples from the 4 groups. (A) The concentrations of propionic acid in the 4 groups. (B) The concentrations of butyric acid in the 4 groups. The levels of both SCFAs were significantly higher in the T2D+P+ group and the T2D−P+ group than in the T2D−P− group, whereas no significant differences were observed among the other groups. The means and standard deviations were calculated and tested for significant differences.
SCFA: short-chain fatty acid, T2D: type 2 diabetes mellitus, P: periodontitis.

