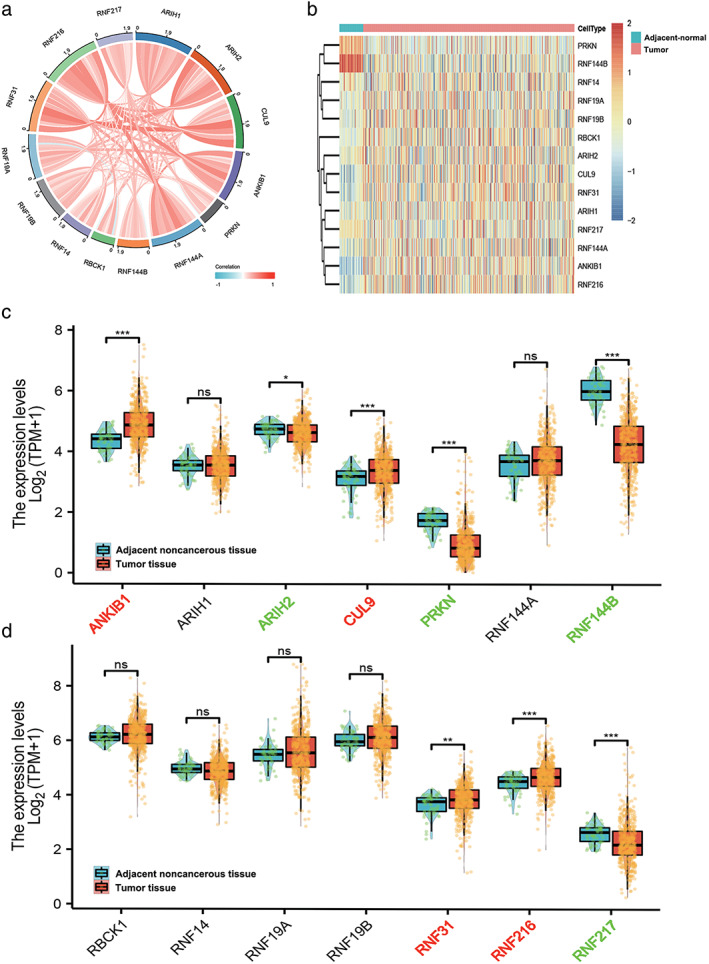
FIGURE 1.

Identification of differentially expressed RBR E3 ubiquitin ligases between LUAD and normal controls in the TCGA‐LUAD database. (a) The correlation among RBR E3 ubiquitin ligases. (b–d) Heatmap and box plots display the distribution of RBR E3 ubiquitin ligases expression between LUAD and normal controls in the TCGA cohort
