


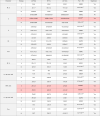
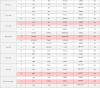
Table 2.
Results with IP plans for the default single run depending on the strategy
|
Abbreviations: BOT = beam-on time; C = coverage; Dmax = maximum dose; Dmean = mean dose; Dmin = minimum dose; EI = efficiency index; GI = gradient index; Gy = gray; = “maximize coverage, favor selectivity”; ii = “maximize coverage, favor BOT”; iii = “maximize selectivity”; IP = inverse planning; n = number; PI = prescription isodose; OAR = organ at risk; PCI = Paddick conformity index; PI = prescription isodose; s = corrected sample standard deviation; S = selectivity; tplan = planning or computational time; ttotal = total set-up time; VX Gy = volume treated with X Gy; X = mean value of the respective parameter for LGP; Y = mean value for IP.
*P < .05.
†P < .01.
‡P < .001.
The EI includes η50%and the efficiency index for multiple targets (Gη12Gy). Highlighted rows have a P value just below .05 but above α*. Values for DOAR transgression should be interpreted with caution because OARs did not exist for every case (eg, metastases). For the strategies i, ii, and iii, 28, 7, and 87 OARs are counted, respectively. Note that sample sizes are different for each strategy and every parameter.