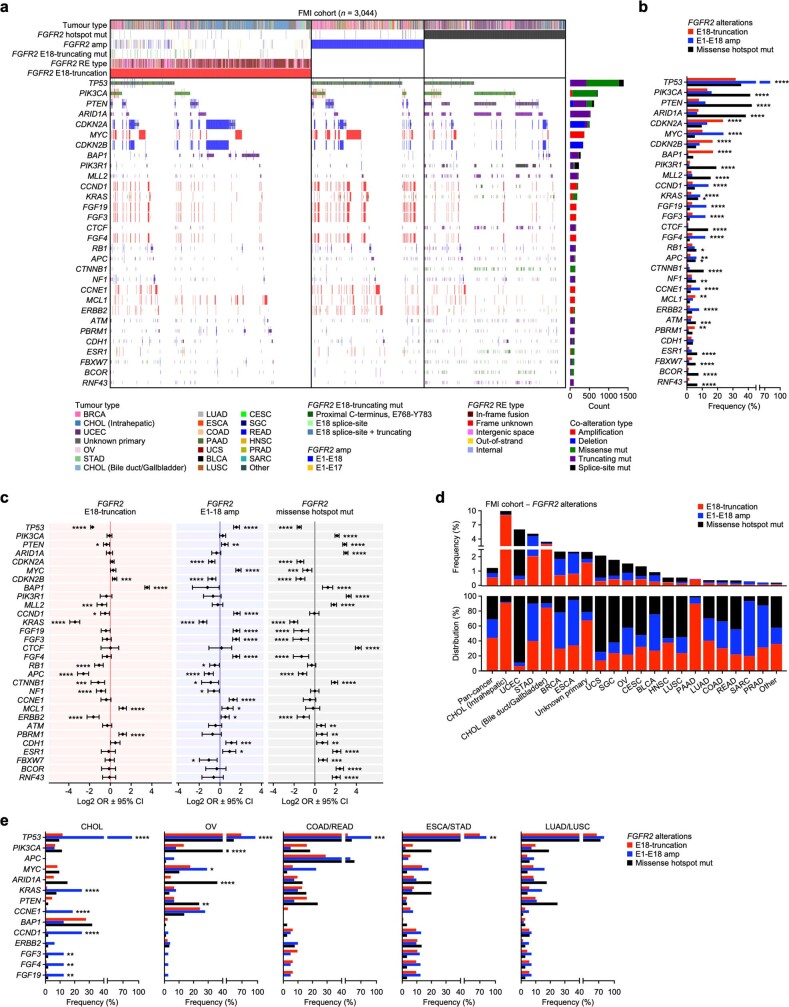
Extended Data Fig. 10. Top driver genes co-occurring in samples with FGFR2 alterations.
a, 3,044 samples classified as either FGFR2-E18-truncated (n = 1,344, 44.2% of total, 0.54% incidence), amplified (n = 757, 24.8% of total, 0.30% incidence), or missense hotspot mutant (n = 943, 31.0% of total, 0.38% incidence) and top-30 co-enriched tumour driver alterations found in the FMI pan-cancer cohort (n = 249,570). b, Enrichments of top-30 tumour driver co-alterations in the indicated FGFR2 alteration categories in the FMI pan-cancer cohort. c, Odds ratios (OR) of top-30 tumour driver co-alterations in the indicated FGFR2 alteration categories (E18-truncation, n = 1,344; E1-E18 amp, n = 757; missense hotspot mut, n = 943) versus FGFR2 WT samples (n = 224,711) of the FMI pan-cancer cohort. Data are represented as log2-transformed OR ± 95% confidence interval (CI). Co-occurrence, OR > 1; mutual exclusivity, OR < 1. d, Frequencies (top panel) and distributions (bottom panel) per tumour type of the indicated FGFR2 alteration categories in the FMI pan-cancer cohort. e, Enrichment of top tumour driver co-alterations in the indicated FGFR2 alteration categories in the FMI-CHOL, OV, COAD/READ, ESCA/STAD, and LUAD/LUSC cohorts. P values were calculated with one-tailed proportion z-tests (b, e) or two-tailed Fisher’s exact tests (c) and FDR multiple-testing corrections using the Benjamini-Hochberg method (b, c, e). *P < 0.05, **P < 0.01, ***P < 0.001, ****P < 0.0001. Sample sizes and statistical details for b, c, e are in Supplementary Table 2.

