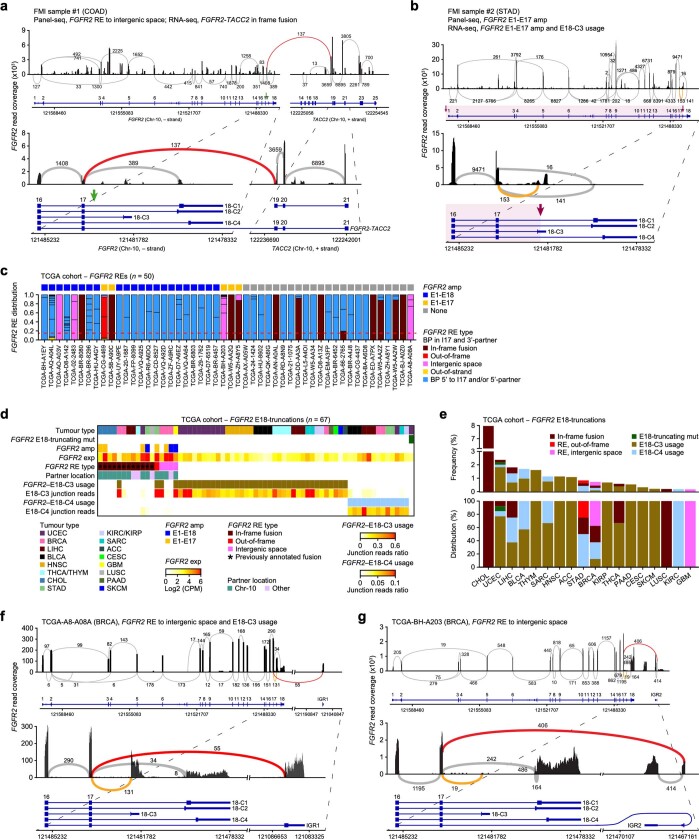
Extended Data Fig. 4. Expression of E18-truncating FGFR2 variants in FMI and TCGA samples.
a, Sashimi plot showing FGFR2 read coverage and junction reads of the FMI sample #1 (COAD). FGFR2-I17 RE to intergenic space was diagnosed by FMI, and discordant FGFR2-TACC2 in-frame fusion with FGFR2-E17 to TACC2-E19 junction was found with hybrid-capture RNA-seq. Green arrows indicate FGFR2 BP identified with panel-seq. b, Sashimi plot showing FGFR2 read coverage and junction reads of the FMI sample #2 (STAD). FGFR2-E1–E17 partial amp was diagnosed by FMI, and high FGFR2 expression with few E17–E18 junction reads but E18-C3 usage was found with hybrid-capture RNA-seq. Purple arrows indicate partially amplified FGFR2 region identified with panel-seq. c, FGFR2 amp status and RE type distribution in samples with FGFR2 REs (n = 50) found in the pan-cancer cohort from The Cancer Genome Atlas (TCGA, n = 10,344 samples). Dotted red line, RE read frequency threshold (> 0.15) to call samples expressing FGFR2ΔE18 REs (n = 17). d, 67 samples (0.65% incidence) containing FGFR2ΔE18 in-frame fusions (n = 12, 0.12% incidence), FGFR2ΔE18 non-canonical REs (n = 5, 0.05% incidence), proximal FGFR2-E18-truncating mutations (n = 1, 0.01% incidence), and cases with significant FGFR2-E18-C3 (n = 40; E18-C3 usage only, n = 36, 90% of total, 0.35% incidence; E18-C3 usage + RE, n = 4, 10% of total, 0.05% incidence) and/or E18-C4 (n = 13, 0.13% incidence) usage found in TCGA cohort. Asterisks mark previously annotated FGFR2 in-frame fusions91. exp, expression; GBM, glioblastoma multiforme; KIRC, kidney renal clear cell carcinoma; KIRP, kidney renal papillary cell carcinoma; LIHC, liver hepatocellular carcinoma; SKCM, skin cutaneous melanoma; THYM, thymoma. e, Frequencies (top panel) and distributions (bottom panel) per tumour type of expressed FGFR2ΔE18 alterations found in TCGA cohort. f, g, Sashimi plots showing FGFR2 read coverage and junction reads of TCGA-BRCA samples A8-A08A (f) and BH-A203 (g) with identified FGFR2-I17 REs to intergenic space and FGFR2-E18-C3 usage.

