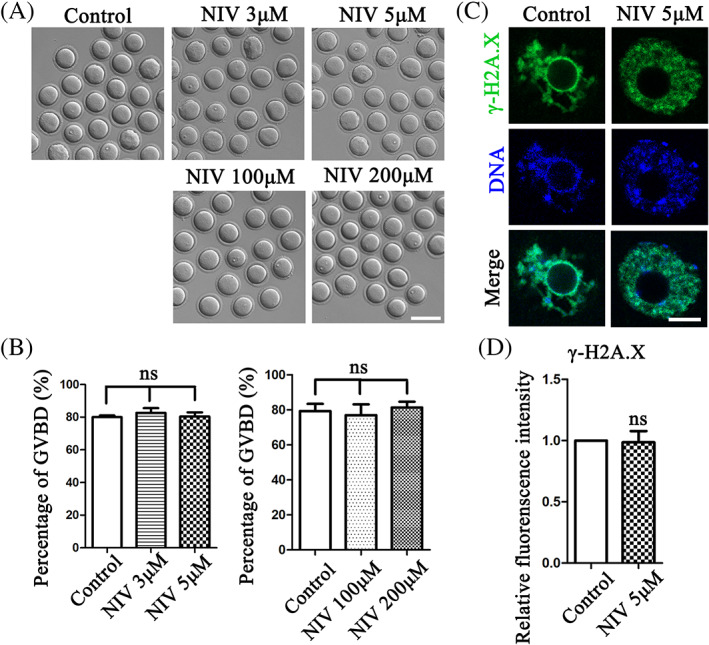
FIGURE 1.

NIV does not affect G2/M transition in oocyte meiosis. (A) The typical image of oocytes underwent GVBD after 2 h culture in the low and high does NIV treatment groups. (Control: n = 121; 3 μM group: n = 118; 5 μM group: n = 116; 100 μM group: n = 113; 200 μM group: n = 124). Bar = 100 μm (B) The GVBD rate of NIV treatment groups was similar with control groups. ns, p > 0.05. (C) Comparing with the control group, there was no change in the 5 μM NIV treatment group after 50 min culture (Control: n = 48; 5 μM group: n = 52). Green, γ‐H2AX; Blue, DNA; Bar = 5 μm. (D) The fluorescence intensity of γ‐H2AX showed no significant difference between control and 5 μM NIV‐treated groups. ns, p > 0.05.
