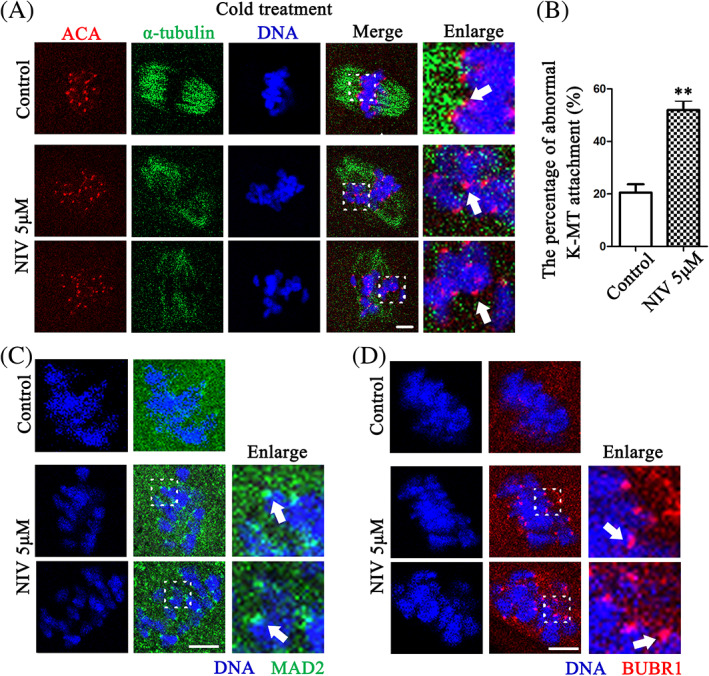
FIGURE 5.

NIV affects K‐MT attachment for SAC in oocyte meiosis. (A) The clear K‐MT stable attachment was observed in the control groups, while there were no microtubules attached to kinetochores after NIV exposure. The arrows highlighted the stable K‐MT attachment in the control and detachment in the treatment oocytes (Control: n = 52; NIV group: n = 60). Red, ACA; Green, α‐tubulin; Blue, DNA; Bar = 10 μm. (B) The percentage of K‐MT detachment in NIV‐treated oocytes was significantly increased compared with control group. **p < 0.01. (C) Stronger MAD2 fluorescence signals were observed at the kinetochores of the treatment group oocytes, while there were no signals in the control group after 9.5 h culture. The arrows indicated MAD2 signals at the kinetochore. Green, MAD2; Blue, DNA; Bar = 5 μm. (D) Stronger BUBR1 fluorescence signals were observed at the kinetochores of the treatment group oocytes, while there were no signals in the control groups after 9.5 h culture. The arrows indicated BUBR1 signals at the kinetochore. Red, BUBR1; Blue, DNA; Bar = 5 μm.
