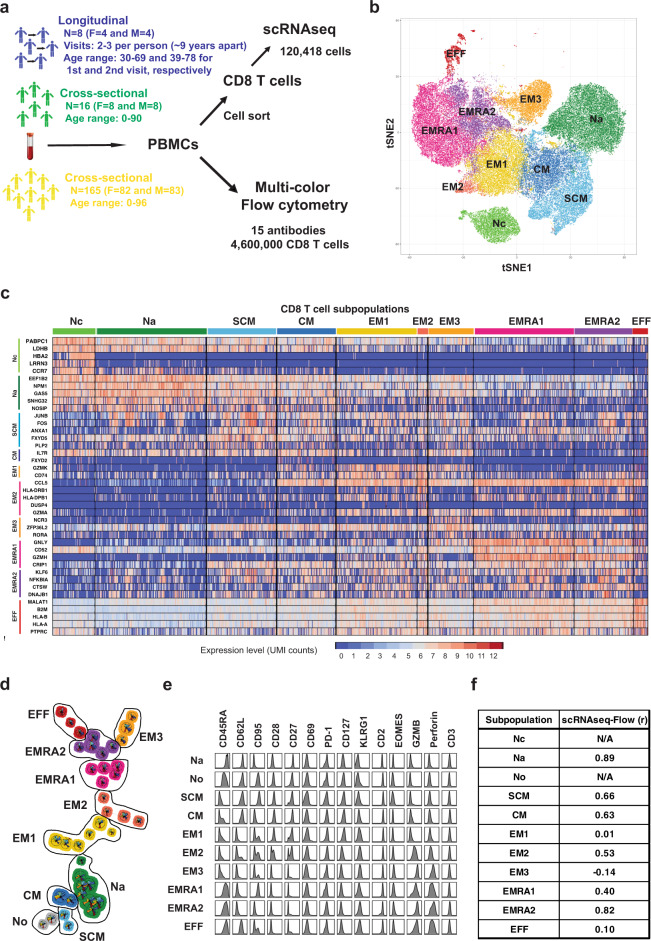
Fig. 1. Identification of CD8+ T cell subpopulations in humans by scRNAseq and high-dimensional flow cytometry.
a Experimental design. Fasting blood samples were from 24 individuals in two cohorts: 16 (aged newborn to 90) for cross-sectional and 8 (aged 30 to 69 at first donation, average 9 years to second donation) for longitudinal analysis for single-cell RNAseq (scRNAseq); and 165 (aged newborn to 96) for multicolor flow cytometry. CD8+ T cells were used for gene expression analysis. Peripheral blood mononuclear cells were used for flow cytometry with CD8+ T cells gated by antibodies and dyes. b t-SNE projection of 120,418 CD8+ T cells clustered by gene expression patterns. CD8+ T cell subpopulations were by comparing differentially expressed genes to previous analyses54 and our unpublished microarray data. c Heatmap depicting differentially expressed genes by cluster (selected by log2FC > 0.1, FDR < 0.05; full gene list, Supplementary Data 1). d FlowSOM map of CD8+ T cell subpopulations from flow cytometry. Node sizes represent relative number of cells with similar expression patterns. Nodes are arranged into populations34; proximity indicates similar expression. Number of nodes is proportional to number of the population’s cells. Clusters were assigned using canonical markers. e Expression histograms for 14 markers per CD8+ T cell cluster from flow cytometry. f CD8+ T cell subpopulations identified by gene expression with matched counterparts from flow cytometry identified by Spearman’s rank correlation of markers and associated genes between flow cytometry and scRNA-seq clusters. Clusters within major subsets (N, CM, EM, RA) were further classified by correlation of change in percentage with age in each donor (Fig. 2a, b). F female, M male, UMI unique molecular identifier, Nc naïve cord blood, Na naive adult, SCM stem cell memory, CM central memory, EM1 2, 3, effector memory subpopulations, EMRA1 2 terminally differentiated effector memory cell subpopulation, EFF effector cells, t-SNE t-distributed stochastic neighbor-embedding.

