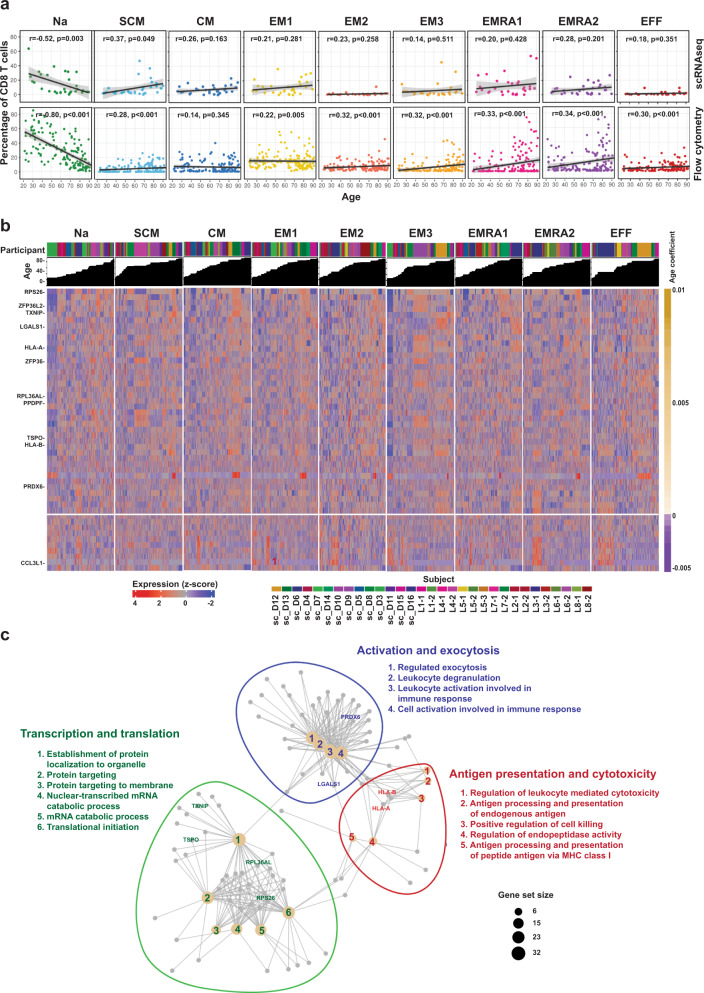
Fig. 2. Age changes in distribution and gene expression in CD8+ T cell subpopulations.
a Percentages of 9 subpopulations in 24 donors as a function of age based on scRNA-seq (top panel). Trend lines were from a mixed-effect linear regression (MELR) model. Percentages of clusters for 165 donors as function of age from flow cytometry (bottom panel). Trend lines were from the MELR model for which the t distribution with n-2 degrees of freedom was used to evaluate if a slope was significant for a particular variable (2 sided t-test). b Expression heatmap of the top 50 most-changed genes with age shared by at least 5 of 9 subpopulations of CD8+ T cells based on scRNA-seq. Top panel, age-increased genes (35 genes); bottom panel, age-decreased genes (15 genes). Full gene list is in Supplementary Data 2b and each data point was the average of 10 cells. c. Network plot of functional changes associated with age and associated genes (Yellow dot, functional gene set; gray dot, core enriched gene in gene set). Genes belonging to a functional set are connected by edges to that function. Nc naïve cord blood, Na naive adult, SCM stem cell memory, CM central memory, EM1, 2, 3, effector memory subpopulations 1, 2, 3, EMRA1 2 terminally differentiated effector memory cell subpopulation 1, 2, EFF effector cells.

