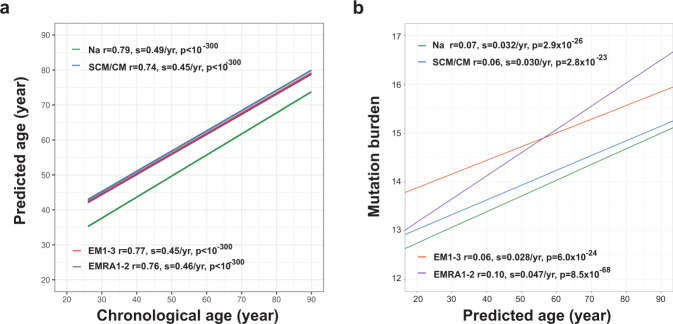
Fig. 6. Age-related transcriptomic changes associated with cell differentiation and divisions.
a Linear regression lines representing the cross validation predicted age for each of four major CD8 + T cell subsets by chronological age of donor. b Linear regression representing the relationship between mutation burden and cross validation predicted age of single cells in four major subsets of CD8+ T cells. Trend lines were from the MELR model for which the t distribution with n-2 degrees of freedom was used to evaluate if a slope was significant for a particular variable (2 sided T-test). The line data are in Supplementary Data 6a, b.

