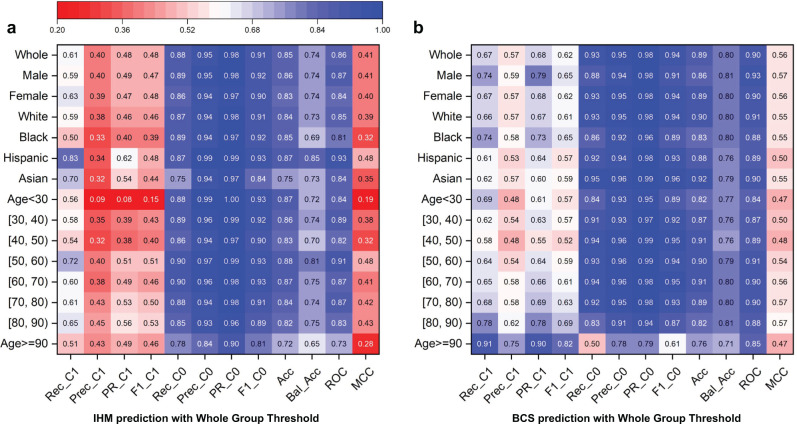
Fig. 3. Prediction results under the original machine learning models (no bias correction) using one optimized threshold for all demographic groups.
Rec_C1, Prec_C1, PR_C1, F1_C1, Rec_C0, Prec_C0, PR_C0, F1_C0, Acc, Bal_Acc, ROC, MCC stand for Recall Class 1, Precision Class 1, Area Under the Precision-Recall Curve Class 1, F1 score Class 1, Recall Class 0, Precision Class 0, Area Under the Precision-Recall Curve Class 0, F1 score Class 0, Accuracy, Balanced Accuracy, Area under the ROC Curve, Matthews Correlation Coefficient (MCC), respectively. a Prediction results for the IHM prediction. Class 1, representing death after staying 48 h in intensive care units at the hospital, is the minority prediction class. Class 0, representing survival after staying 48 h in intensive care units, is the majority prediction class. b Prediction results for the BCS prediction. Class 1, representing death 5 years after a breast cancer diagnosis, is the minority prediction class. Class 0, representing survival after 5 years, is the majority prediction class.

