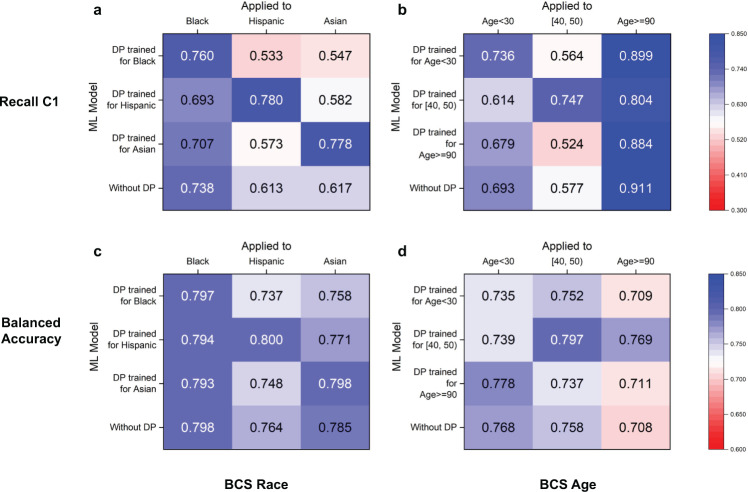
Fig. 8. DP’s cross-group performance under various race and age settings for recall C1 and balanced accuracy in BCS prediction.
In subfigures, each row corresponds to a DP model trained for a specific subgroup. Each column represents a subgroup that a model is evaluated on. The values on the diagonal are the performance of a matching DP model, i.e., a DP model applied to the subgroup that it is designed for. The last rows show the group’s performance in the original model. To prevent overfitting, our method chooses optimal thresholds based on whole group performance. DP cross-group performance for a race subgroups and b age subgroups for the BCS prediction in terms of recall C1. DP cross-group performance for c race subgroups and d age subgroups for the BCS prediction in terms of balanced accuracy.

