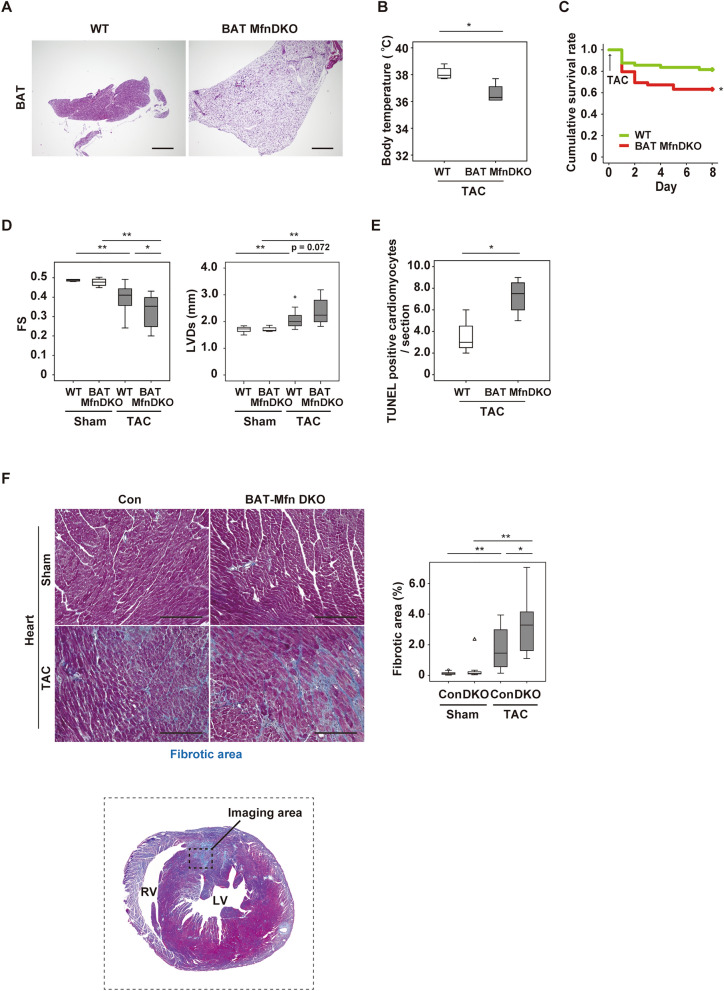
Figure 2.
Brown adipose tissue dysfunction deteriorates cardiac function after TAC. (A) Hematoxylin and eosin (HE) staining of BAT from 8-week-old littermate control (WT) mice or BAT-specific Mfn1/Mfn2 DKO (BAT Mfn DKO) mice. Scale bar = 500 μm. (B) Body temperature of mice at 2 weeks after TAC (n = 4, 4). (C) Cumulative survival rate of mice at 1 week after TAC (n = 49, 49). (D) Assessment of cardiac function in the indicated mice at 1 week after Sham or TAC (FS; n = 5, 4, 28, 16, LVDs; n = 5, 4, 28, 16). (E) Quantification of TUNEL-positive cardiomyocytes in the hearts of mice at 1 week after TAC (n = 4, 4). (F) Masson’s trichrome staining of hearts from the mice. The right panel shows quantification of the fibrotic area (n = 13, 10, 21, 13). Scale bar = 50 μm. Data were analysed by the 2-tailed Student’s t-test (B, E), 2-way ANOVA followed by Dunnett’s comparison test (D), or the log-rank test for Kaplan–Meier method (C). *P < 0.05, **P < 0.01. Values are shown as the mean ± s.e.m.

