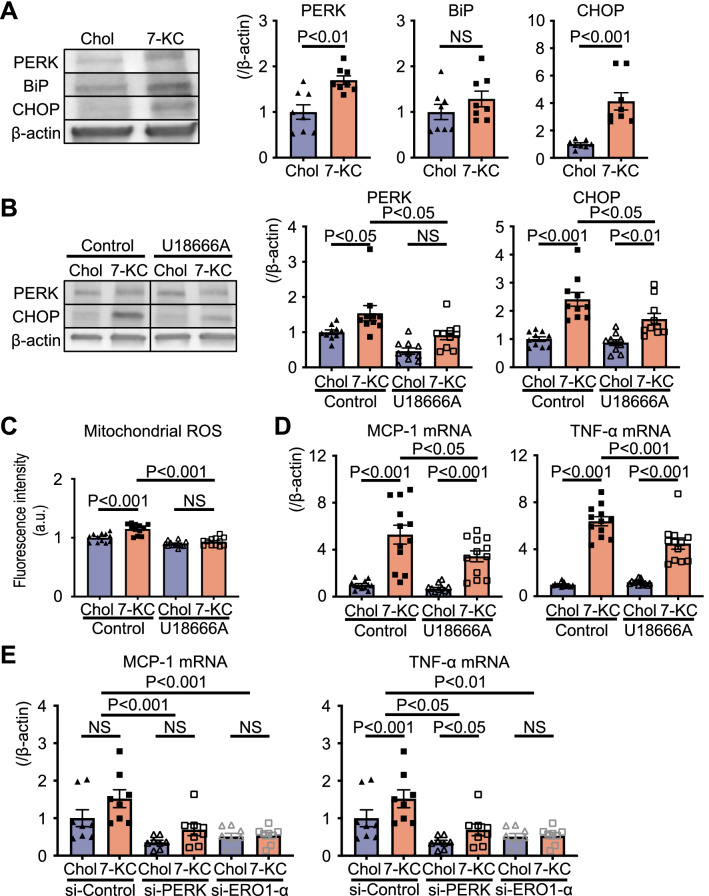
Figure 5.
7-KC induced ER stress and subsequently ROS. (A) Proteins related to ER stress in peritoneal macrophages treated with 10 µM cholesterol or 7-KC for 24 h. N = 8. The data were analyzed by unpaired t test. Original blots/gels are presented in Supplementary Fig. S7. (B–D) Effect of the cholesterol transport inhibitor U18666A on peritoneal macrophages pretreated with 3 µM U18666A for 1 h. (B) Proteins related to ER stress. N = 10. The data were analyzed by one-way ANOVA, followed by Tukey’s post-hoc multiple comparison test. Original blots/gels are presented in Supplementary Fig. S8. (C) Mitochondrial ROS measured using MitoSOX. N = 12. The data were analyzed by one-way ANOVA, followed by Tukey’s post-hoc multiple comparison test. (D) Expression of cytokines quantified by RT–PCR. N = 12. The data were analyzed by one-way ANOVA, followed by Tukey’s post-hoc multiple comparison test. (E) Effect of siRNA specific for PERK or ERO1-α. Expression of cytokines quantified by RT–PCR. N = 8. The data were analyzed by two-way ANOVA, followed by Tukey’s post-hoc multiple comparison test. Chol, cholesterol; 7-KC, 7-ketocholesterol; PERK, PKR-like endoplasmic reticulum kinase; BiP, binding immunoglobulin protein; CHOP, C/EBP homologous protein; ROS, reactive oxygen species; ER, endoplasmic reticulum; ERO1-α, ER oxidase 1 α; si-Control, nontargeted control siRNA; si-PERK, siRNA against PERK; si-ERO1-α, siRNA against ERO1-α.

