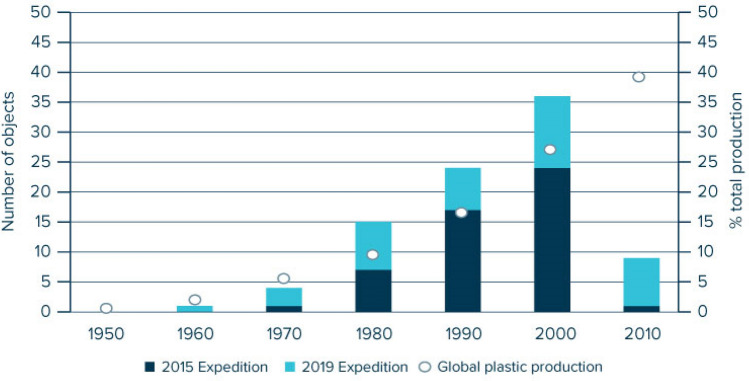
Figure 3.
Distribution of production date labels identified on plastic objects collected from the North Pacific Garbage Patch in 20153 (n = 50) and in 2019 (this study, n = 39). See Supplementary Table S8 for joint values with identified countries of origin identified for this study. Dots represent relative distribution of global plastic production per decade51. Note that global production for the years 2016–2019 was estimated by extrapolating the exponential production increase as observed during the years 1980–2015 (see Supplementary Fig. S2, Supplementary Table S11).

