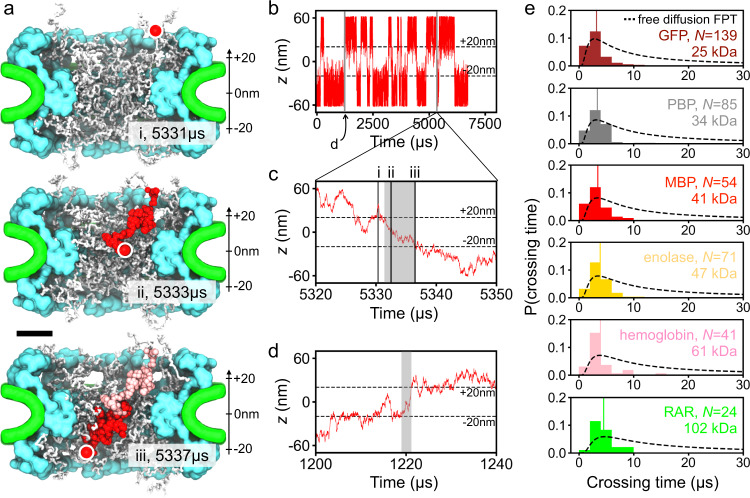
Fig. 3. Timescale of protein crossings.
a Successful translocation of a maltose-binding protein (MBP, red) through the NPC. Three instantaneous configurations of the NPC are shown using white for the FG-nups, cyan for the protein scaffold and green for the lipid bilayer. The circle indicates the location of the MBP protein at each configuration. Red and pink beads illustrates the configurations explored by the protein between the instantaneous configurations (sampled every 25 ns). Scale bar, 20 nm. b CoM z coordinate of MBP simulated under a 25 nm-radius confinement potential. Two crossing events form this trace are shown in detail in panels c and d. c Zoomed-in on the crossing event trace. The same event is illustrated by snapshots (i, ii, iii) in a. d Example of another crossing event. The gray rectangles in panels c and d illustrate the time interval defined as a crossing time for the analysis shown in e. e Distribution of crossing times for six protein species. N specifies the total number of crossing events used to construct each histogram. Each normalized histogram was constructed using 15 evenly-spaced bins, from 0 to 30 μs, and the crossing time data from both confinement potential simulations. The average of each histogram is shown as a vertical line. The dashed lines show the distributions of first-passage time for a freely diffusing particle of the same diffusion constant as that of the corresponding protein.

