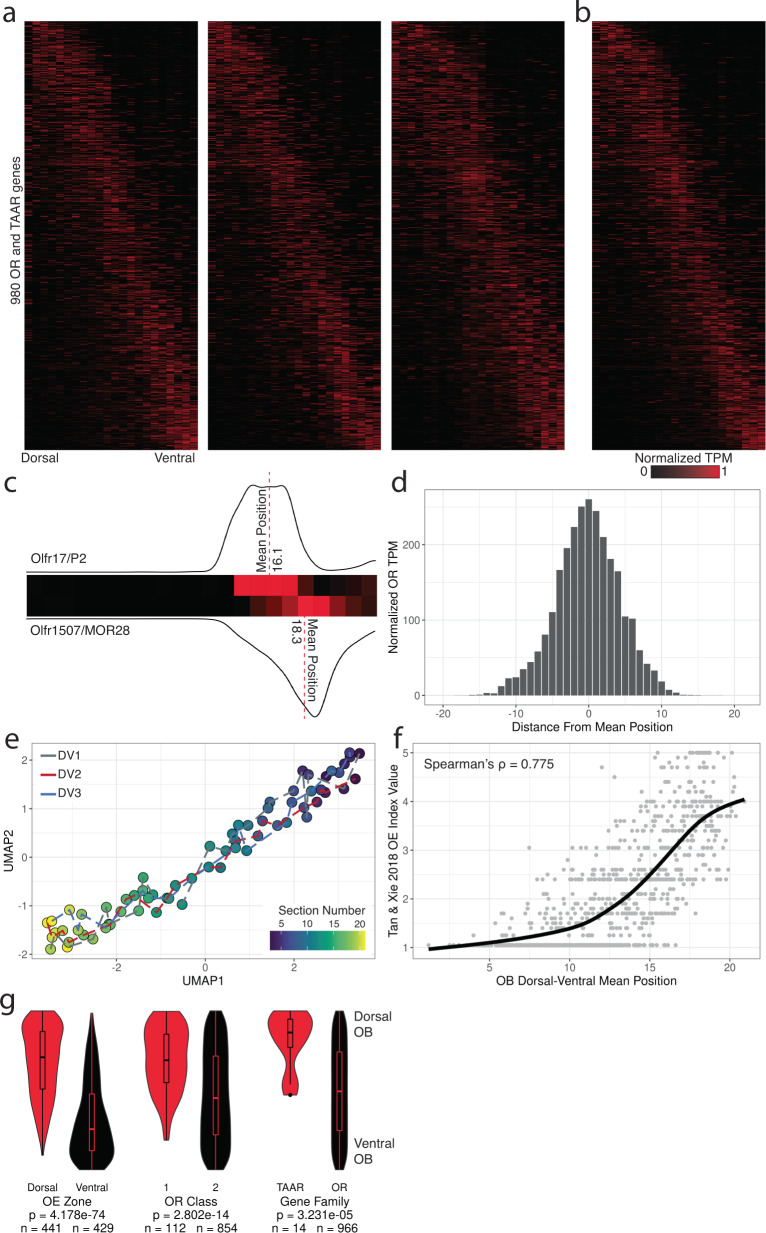
Fig. 2. Glomerular OR expression correlates with OE expression along the DV axis.
a Heatmaps for expression of 980 OR and TAAR genes across 22 DV sections sorted by mean position of expression from three replicate mice. Source data provided as a Source Data file. b Merged representation of DV replicates. Ordering of genes (y-axis) is consistent across all heatmaps. c Depiction of DV mean position for two ventral OR transcripts, Olfr17/P2 and Olfr1507/MOR28, based on the transcriptomic weighted average of position from an individual replicate dataset. d Distribution of normalized TPM (maximum observed value = 1, minimum observed value = 0) for all 980 OR and TAAR mRNA from position of mean expression. e UMAP projection of 22 DV sections from all three replicates. f Loess-smoothed regression of OE DV index from Tan and Xie, Chem. Senses 2018 across DV mean positions from our targeted spatial data. g Distribution of ranked DV mean positions for the 980 OR and TAAR transcripts by OE zone, OR class, and gene family. Statistic is Mann-Whitney U-test. Source data provided as a Source Data file.

