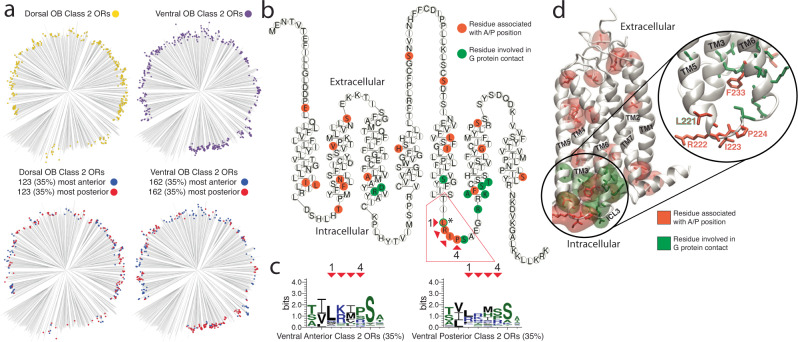
Fig. 5. Amino acid residues associated with anterior and posterior targeting ORs.
a Phylogenetic tree of all Class II dorsal OB OR proteins (top left, n = 354), all Class II ventral OB ORs (top right, n = 464), the most anterior (35%, blue) and most posterior (35%, red) Class II ORs from the dorsal (bottom left) and ventral OB (bottom right) DV zones. b Snakeplot of the Class II OR consensus protein sequence; orange residues have significantly different physicochemical properties for ventral, anterior, or posterior Class II ORs compared to all ventral Class II ORs. Green residues indicate residues known to be involved in Class A GPCR activation through contact with the G protein (* indicates the single residue which was identified as being both associated with G protein contact and identified as significantly different for ventral, anterior, Class II ORs). Source data provided as a Source Data file. c Protein sequence logos for the four identified intracellular loop 3 residues associated with ventral Class II anterior/posterior ORs depicting the conservation of specific amino acid residues at each position. Red arrows indicate the specific residue within the Class II OR consensus snakeplot (C) and the corresponding position in the sequence logo. d Homology model of the mouse Class II consensus OR protein structure. Transmembrane helices (TM) are numbered with residues associated with AP positions (orange) and residues in contact with the G protein (green) depicted with transparent regions indicating the residue surface. Right, highlight of intracellular loop 3 (ICL3) where residues associated with AP positions are intermingled with the residues in contact with the G protein.

