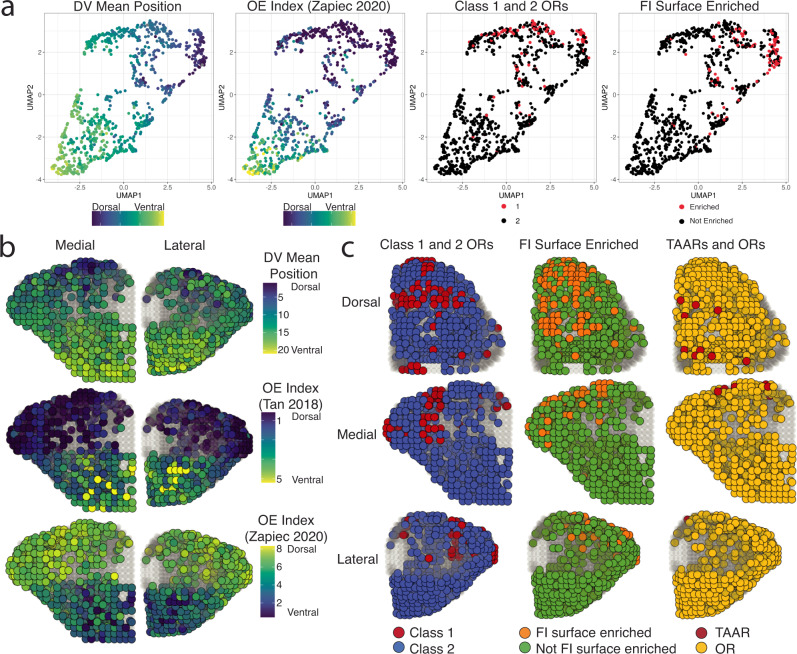
Fig. 6. A three-dimensional model for OR glomerular positions from combined single-dimension targeted sequencing data.
a UMAP projections of OR transcript populations constructed using the mean transcript position from each individual replicate from the AP, DV, and ML dimensions. DV mean position color reflects the calculated average mean position from all DV replicates. OE Index (Zapiec 2020) refers to the OE index established by Zapiec and Mombaerts Cell Reports 2020. FI Surface refers to the differential expression analysis calculated from dorsal and ventral OB samples in this paper. b Three-dimensional assigned positions for the 709 OR and TAAR transcripts with DV mean positions (top) and with observed values in OE DV indices (middle and bottom). Source data provided as a Source Data file. c Three-dimensional assigned positions for the 709 OR and TAAR transcripts with colors revealing contrasting distributions of Class I vs Class II ORs, functional-imaging-surface-enriched vs not-enriched OR and TAAR transcripts vs OR transcripts.

