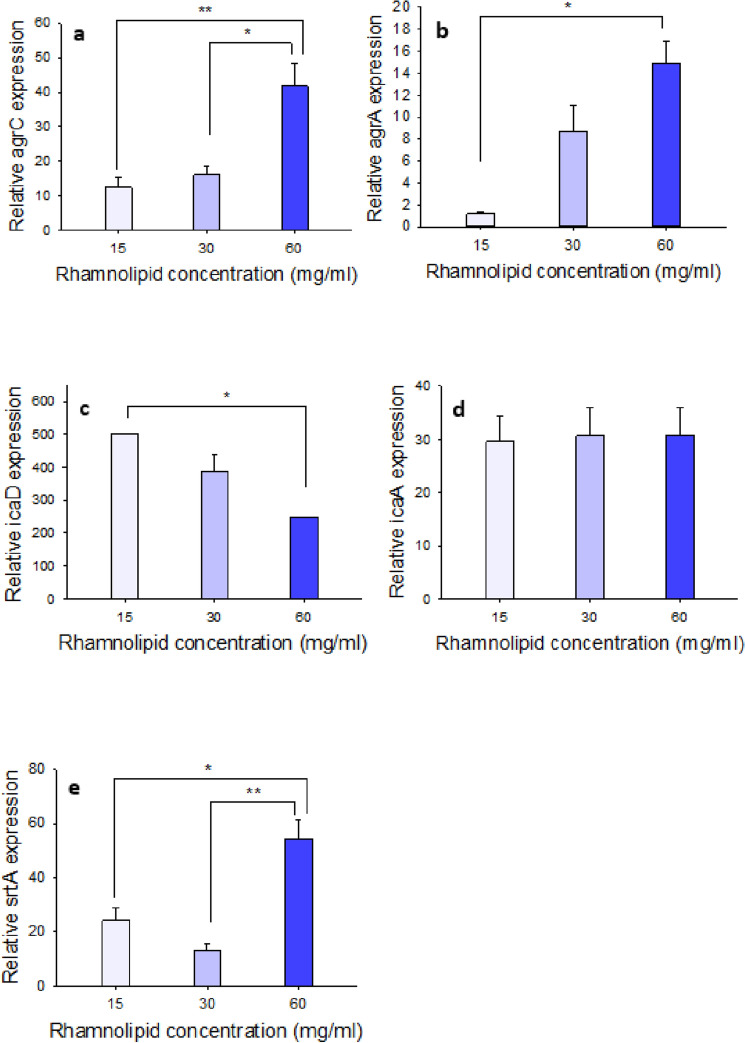
Figure 7.
Assessment of the expression of genes involved in biofilm formation of MRSA after treatment with different concentrations of rhamnolipid (15, 30, 60 mg/mL) by using real-time PCR technique; the expression of all studied genes such as; (a) agrA, (b) agrC, (c) icaA, (d) icaD, and (e) srtA compared with their untreated conditions (with neutral pH) had a significant decrease. There is a statistically significant difference between groups that showed by the symbol *P < 0.05 and **P < 0.005 via one-way ANOVA (Tukey test) and Changes in expressing all columns of each diagram are drawn compared to control mode.

