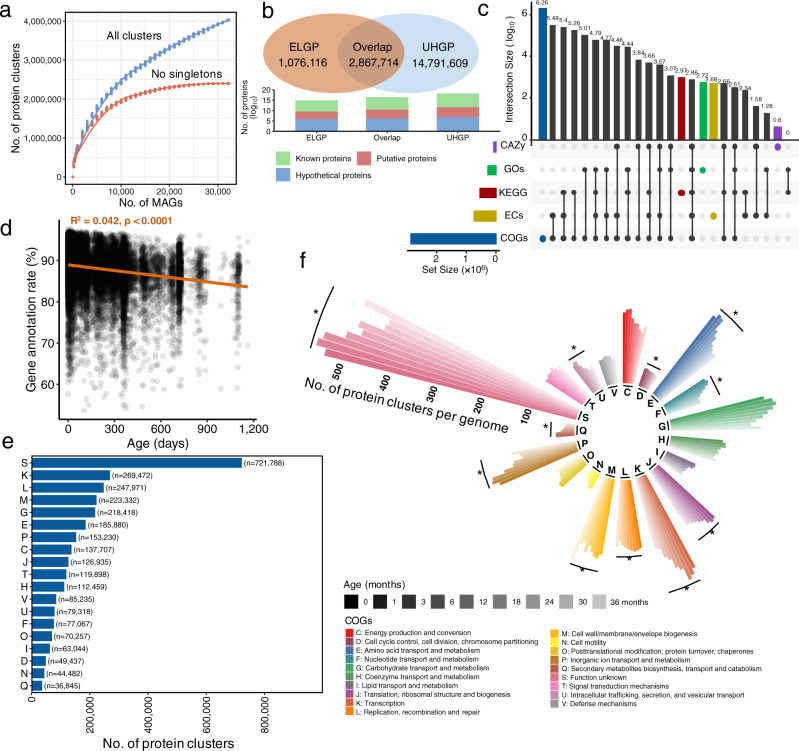
Fig. 2. The ELGP catalog and functional characterization.
a Rarefaction analysis of the number of protein clusters of early-life gut microbiome at 95% amino acid identity as a function of the number of genomes included. Curves are depicted for all the protein clusters and after excluding singleton protein clusters (containing only one protein sequence). b Overlap between the ELGP (orange) and UHGP (blue), both clustered at 95% amino acid identity. The bars at bottom indicate the number of proteins that the cluster representatives from three categories (ELGP exclusive, Overlap, and UHGP exclusive) encode, stratified as known, putative, and hypothetical proteins. c Number of proteins with functional annotation across the five functional categories and their degree of overlap. Vertical bars represent the number of proteins unique (color) to each functional category or shared (black) between the specific functional categories. Horizontal bars in the lower panel indicate the total number of proteins with functional annotation in each functional category. d Dynamics of the rate of protein characterization of ELGP along with the age of children. e COG functional annotation of the ELGP catalog clustered at 95% amino acid identity. Only functions with >5000 genes are plotted. f Dynamics of the rate of COG functional annotation of ELGP catalog clustered at 95% amino acid identity in response to the age of children. Vertical bars from left to right represent the age of children at 0, 1, 3, 6, 12, 18, 24, 30, and 36 months. Asterisk (*) indicates the significant difference (two-tailed Wilcoxon test, FDR < 0.05) between the rate of COG functional annotation of ELGP catalog at birth and 36 months old children.

