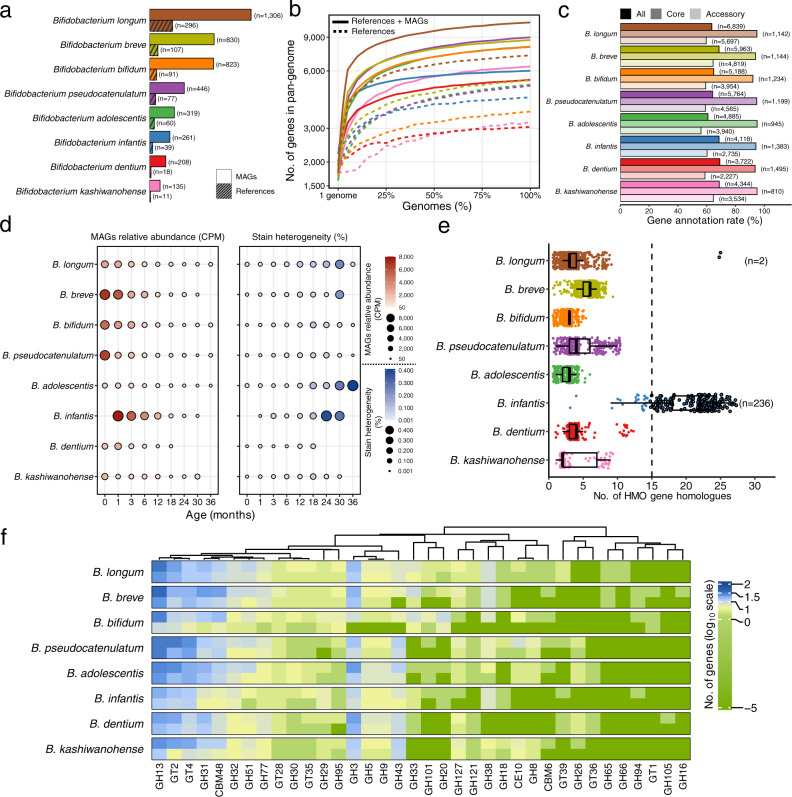
Fig. 4. Characterization of key early-life Bifidobacterium spp. from ELGG catalog.
a The number of genomes stratified by MAGs and reference genomes. b The pan-genome plot represented by the accumulated number of genes as a function of the number of genomes stratified by MAGs and reference genomes. c The rate of functional annotation across databases of COGs, KEGG, GOs, ECs, and CAZy for each species stratified by core and accessory genes. The number in parentheses indicates the number of genes with functional annotation. d Dynamics of the relative abundance and strain heterogeneity of MAGs in response to the age of children. e The number of gene homologs matched to a well-characterized gene cluster responsible for HMOs utilization from each species. Boxes show the interquartile range (IQR), with the vertical line as the median, the whiskers indicating the range of the data (up to 1.5× IQR), and points beyond the whiskers as outliers. f The glycobiome (columns) colored by the number of genes per genome (rows) of each species annotated with the CAZy database. The log10 scaled value (after adding a pseudocount of 1 × 10⁻⁵ to avoid non-finite values resulting from zero gene) is plotted.

