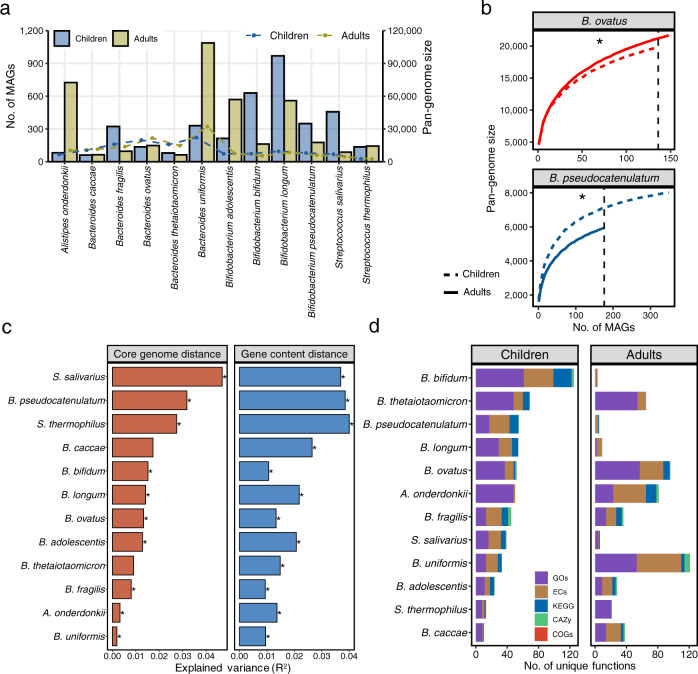
Fig. 6. Comparisons of gut microbiome between children and adults.
a Number of genomes (bar plot) and pan-genome size of each species from children and adults. b Pan-genome plot represented by the accumulated number of genes against the number of genomes of B. ovatus and B. pesudocatenulatum stratified by children and adults (two-tailed Wilcoxon test, *FDR < 0.05). c The explained variance (R2) contributed by age (children and adults) based on the hamming distance of core genes per species and Jaccard distance of presence/absence genes (two-tailed Wilcoxon test, *FDR < 0.05). d The unique functional annotations belonging to either children or adults categorized by databases of COGs, KEGG, GOs, ECs, and CAZy.

