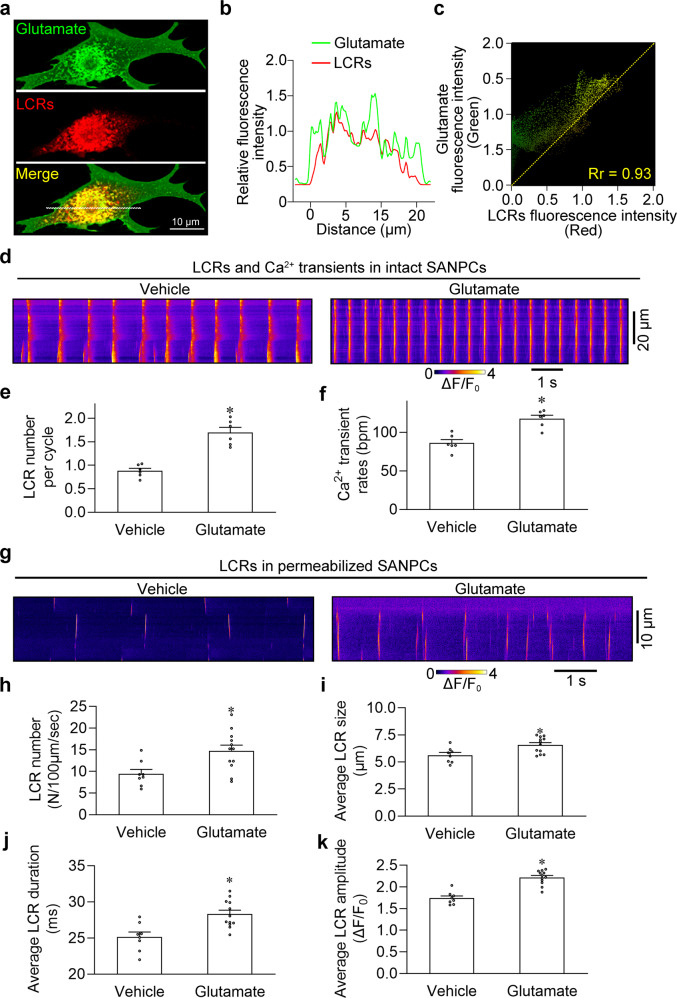
Fig. 2. Colocalization of glutamate accumulation and LCR events in rat SANPCs.
a Representative confocal images demonstrating the subcellular colocalization of glutamate accumulation and LCR events. b Line plot profiles of the fluorescence along the white dotted line in a. c Scatterplots showing the Pearson’s correlation coefficient (Rr) between the fluorescent signals of glutamate accumulation and LCR events. d Typical traces of spontaneous Ca2+ transients in SANPCs upon the intracellular injection of vehicle or 5 mM glutamate. e, f Pooled data from d demonstrated that glutamate application significantly increased the LCR number per cycle (e) and the Ca2+ transients rates (f) in SANPCs compared with the vehicle (n = 6 per group). g Representative confocal line-scan images of LCRs in permeabilized SANPCs. h–k The pooled data from g demonstrated that the application of 5 mM glutamate significantly increased LCR number (h), LCR size (i), LCR duration (j) and LCR amplitude (k) in permeabilized SANPCs compared to the vehicle group (n = 8–12 cells per group, cells were isolated from at least 5 rats). *P < 0.05, calculated by unpaired Student’s t-test.

