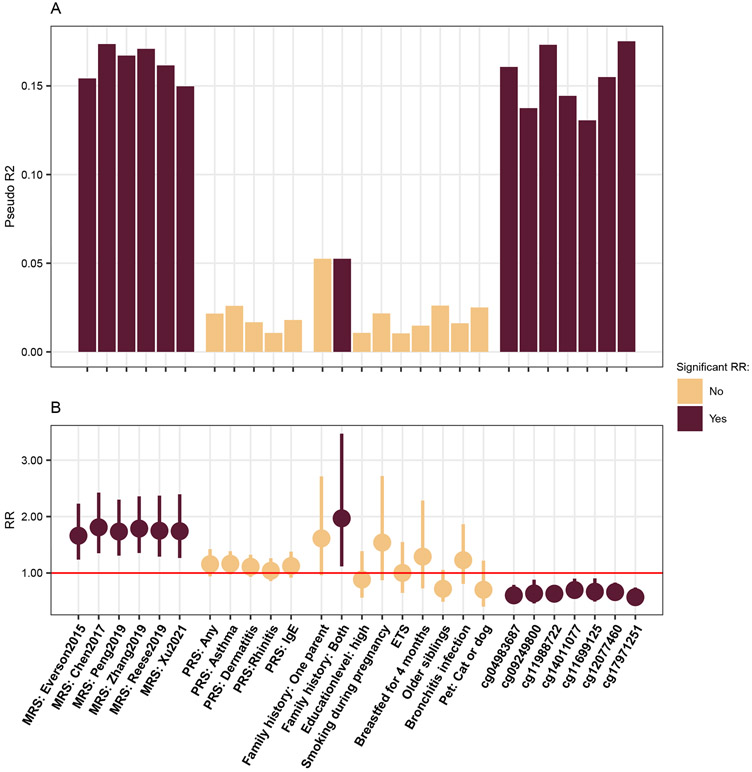
Figure 3:
Prediction accuracy of MRS in comparison to other known risk factors. (A) Explained variance was assessed using logistic regression and (B) RR and 95%-CI using Poisson regression with robust standard errors. For continuous variables (MRS, PRS and CpGs z-scores were used, hence the RR estimate can be understood per one standard error increase. All models were adjusted for sex, age and those with MRS and single CpGs additionally for cell type proportions and whether the blood was taken within the allergy season. Significance was determined in the Poisson model with a threshold of 0.05.

