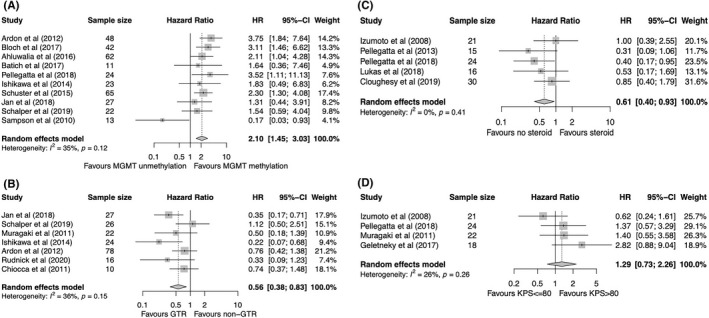
FIGURE 3.

Forest plot of HR for PFS of GBM patients treated with immunotherapy according to (A) MGMT promoter methylation status, (B) extent of resection, (C) baseline steroid use, and (D) KPS scores. Gray squares signify point estimates, and square sizes are proportional to study weights. Horizontal lines represent effect size confidence intervals. Diamonds represent pooled effect size; their lengths represent the 95% confidence interval of the pooled estimate. GBM, glioblastoma; HR, hazard ratio; KPS, Karnofsky Performance Status; MGMT, O6‐methylguanine‐DNA methyltransferase; PFS, progression‐free survival.
