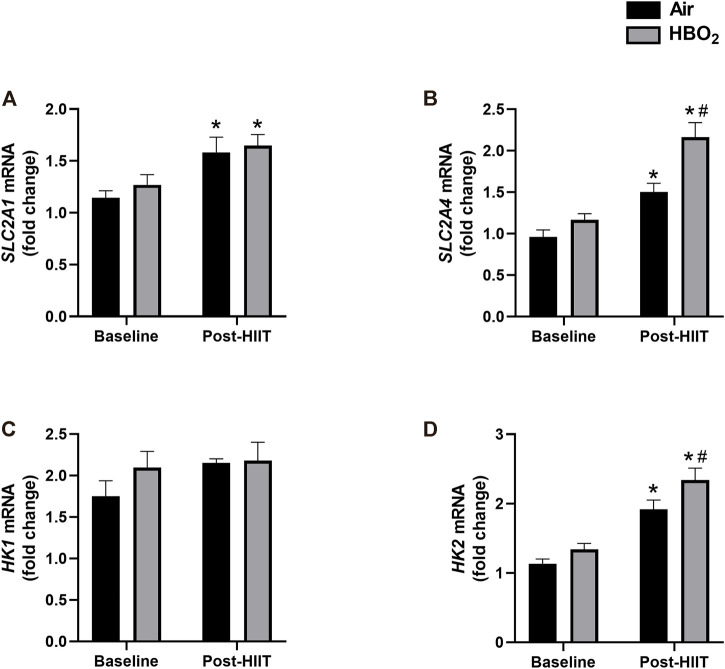
FIGURE 6.
Glucose-related gene expression. mRNA levels of the following genes were measured by quantitative PCR: (A) SLC2A1, Solute carrier family 2, facilitated glucose transporter member 1; (B) SLC2A4, Solute carrier family 2, facilitated glucose transporter member 4; (C) HK1, hexokinase-1; and (D) HK2, hexokinase-2. Reference mRNA was 18S and shown as fold-change. Statistical analysis was 2-way ANOVA with repeated measures and Fisher’s LSD post-hoc test. *p <0.05 shows significant within group comparison (i.e. baseline vs. post-HITT) and #p <0.05 shows significant between group comparisons (i.e. air, black bars vs. HBO2, grey bars).

