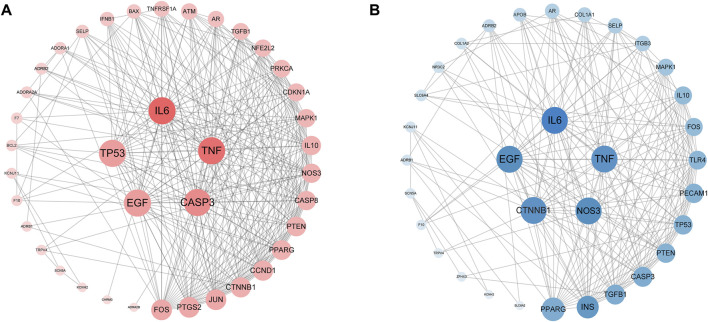
FIGURE 3.
Protein–protein interaction network. (A) The pink nodes represent the targets of bradyarrhythmia; the PPI network structure of bradyarrhythmia has 40 nodes and 321 edges. (B) The blue nodes represent the targets of tachyarrhythmia; the PPI network structure of tachyarrhythmia has 33 nodes and 207 edges. The sizes of the nodes of the two images are illustrated from large to small in descending order of degree values.

