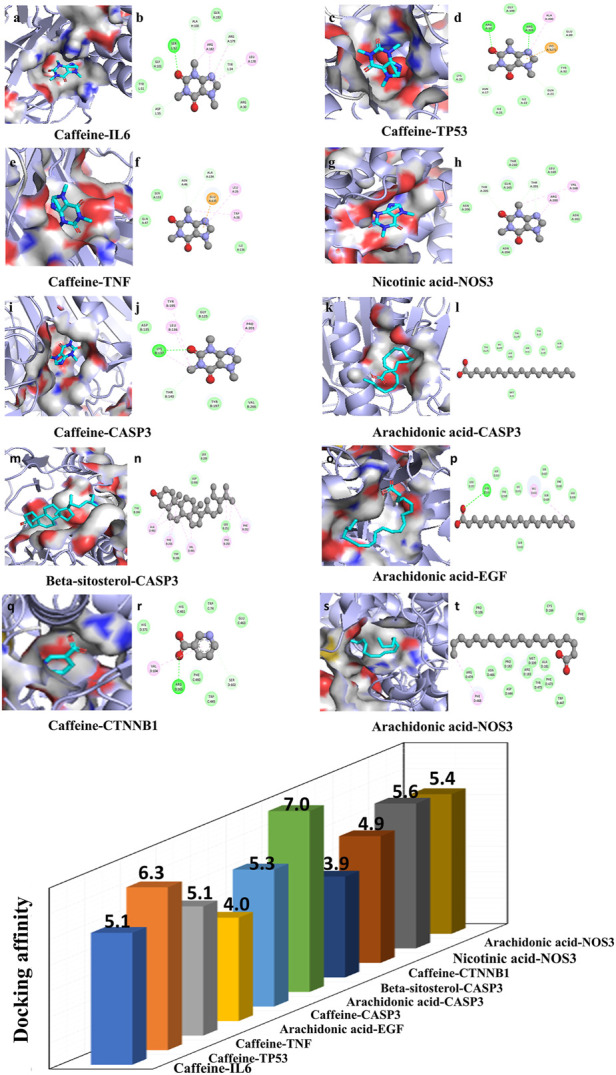
FIGURE 6.

Molecular docking diagram. (A) Ten conformations of molecular docking simulation. Diagrams (3D) indicate that the molecular model of the compound is in the binding pocket of the protein. The compound is shown as a stick model with orange coloring. The amino acid residues surrounding are represented by surface style (A,C,E,G,I,K,M,O,Q,S). Diagrams (2D) show the interactions between the compound and surrounding residues (B,D,F,H,J,L,N,P,R,T). (B) The 3D column diagram shows the affinity of 10 conformations. X-axis: bioactive component, Y-axis: target names, Z-axis: docking affinity (absolute value of the binding energy). Taking the caffeine-IL6 docking, for example, the small molecule ligand caffeine potentially fits into the interface pocket formed by the interaction of amino acid residues in protein (Figure 6A). As shown in Figure 6 (B), a hydrogen bond was formed with caffeine SER52 near the active site of IL6. The other essential residues (ASP55, TUR51, GLY101, ALA100, GLN183, ARG182, ARG179, TYR34, LEU178 and ARG30) through van der Waal’s forces, carbon hydrogen bond, pi-donor hydrogen bond, pi–pi T-shaped, alkyl, and pi–alkyl. These forms of hydrogen bonds and interactions contribute to the stability of the binding of small molecules to the active sites of proteins.
