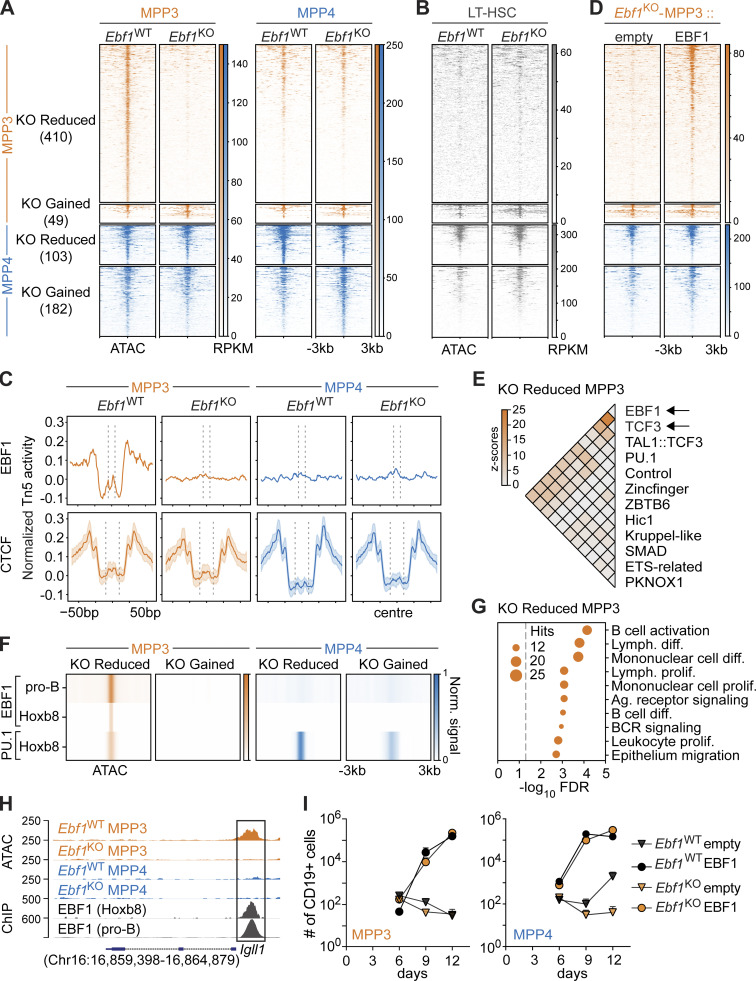
Figure 3.
EBF1 primes the B-lymphoid fate in myeloid-biased MPP3 progenitors. (A and B) Heatmap displaying chromatin accessibility at DA peaks in MPP3 and MPP4 cells (A) and in LT-HSCs (LSK CD34−Flt3−CD150+CD48−; B) from Ebf1WT and Ebf1KO mice. Biological replicates n = 2. (A, B, and D) Peaks are organized into KO Reduced and KO Gained peaks, in MPP3 cells and MPP4 cells. Regions ± 3 kb around the center of the peak are shown. Heatmap scale represents RPKM. (C) Aggregation plots showing Tn5 activity in MPP3 and MPP4 cells from Ebf1WT and Ebf1KO conditions, at KO Reduced MPP3 peaks centered around the EBF1 motif (top row). Median aggregation plot for 100 random sets of CCCTC-binding factor (CTCF) motifs found in the ATAC peak set (bottom row). The shaded area depicts the SD. (D) Heatmap displaying chromatin accessibility at DA peaks in MPP3 cells from Ebf1KO mice upon EBF1 re-expression and empty vector expression. (E) Heatmap displaying z-scores of co-occurrence counts in KO Reduced MPP3 peaks versus co-occurrence counts in all MPP3 peaks (1,000 replicates) of enriched motifs in KO Reduced MPP3 peaks. (F) Heatmap displaying average ChIP signal for EBF1 and PU.1 ChIPs at DA peaks. The RPKM signal is scaled over all four DA peak sets. (G) Enrichment analysis of genes associated with KO Reduced MPP3 peaks. (H) Genome tracks showing ATAC signal and EBF1 ChIP signal at B-lymphoid related KO Reduced MPP3 peaks annotated to the Igll1 gene. (I) Absolute number of CD19+ B cells at indicated time points upon EBF1 re-expression and empty vector expression, in Ebf1WT and Ebf1KO MPP3 and MPP4 cells. Data are from >2 independent experiments. (F and H) Original data from Kucinski et al. (2020); Li et al. (2018).

