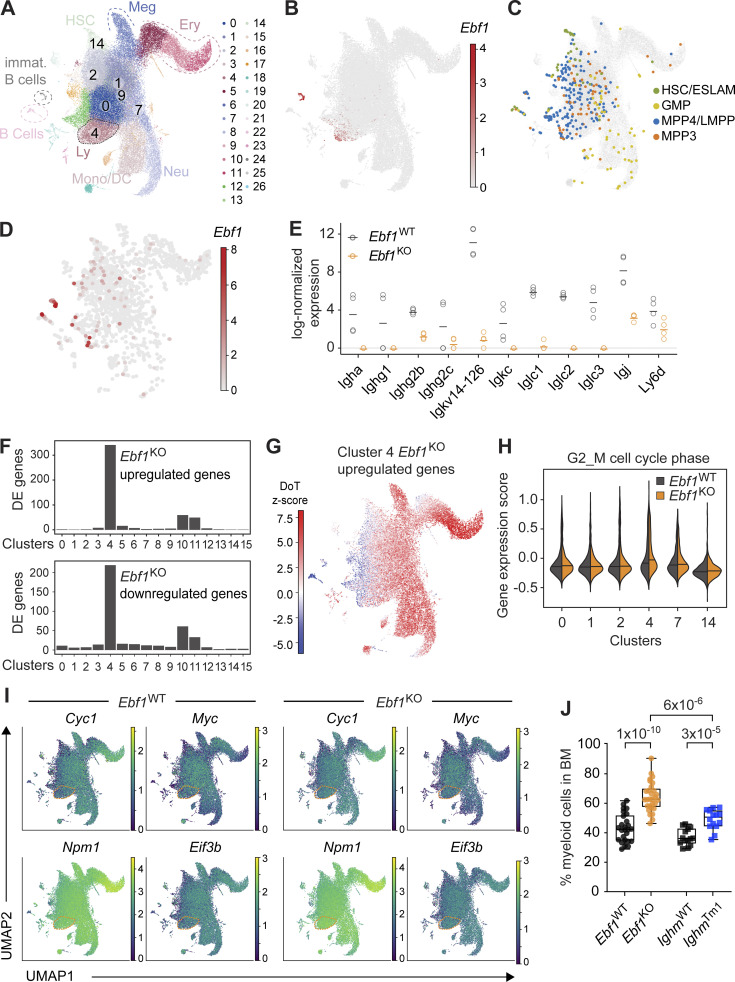
Figure 6.
Ebf1 controls lymphoid/myeloid balance in HSPCs, and its loss causes increased myeloid cells in the BM. (A and C) Annotated UMAP projection of scRNA-seq landscape derived from Ebf1WT and Ebf1KO LK and LSK populations. Biological replicates n = 4. (B and D) Log-normalized Ebf1 expression for Ebf1WT cells shown in A and C, respectively. (C) Cells from Nestorowa data (Nestorowa et al., 2016; colored) were embedded into the Ebf1WT/Ebf1KO landscape (gray) with annotated immunophenotypic populations. (E) Log-normalized expression of Ig and lymphoid-associated DE genes in Ebf1WT and Ebf1KO cells of selected clusters. Each dot represents the mean expression per mouse (four mice in total). (F) Number of DE genes between Ebf1WT and Ebf1KO cells per cluster. (G) DoT scores calculated using DE genes in cluster 4 between Ebf1WT and Ebf1KO cells in the context of the LK/LSK landscape. Mean expression in cluster 4 was used as the point of origin. Red indicates a shift toward that cell fate and blue indicates a shift away from that cell fate. (H) Violin plots showing the gene expression score of G2/M cell cycle–associated genes in Ebf1WT and Ebf1KO cells in selected clusters. (I) UMAP visualization of the expression of Myc and selected Myc target genes in Ebf1WT and Ebf1KO cells. (J) Boxplots showing the frequency of myeloid cells (CD11b+) in the BM. Ebf1WT n = 18, Ebf1KO n = 16, IghmWT and IghmTm1 n = 11. Statistical significance was determined by Mann–Whitney U test. Data are from >2 independent experiments. LK defined as Lin-cKit+ cells. ESLAM, CD45+EPCR+CD48−CD150+ HSCs; Meg, megakaryocyte; Ery, erythrocyte; Neu, neutrophil; Mono/DC, monocyte/dendritic cell; Ly, lymphocyte.

