Figure S1.
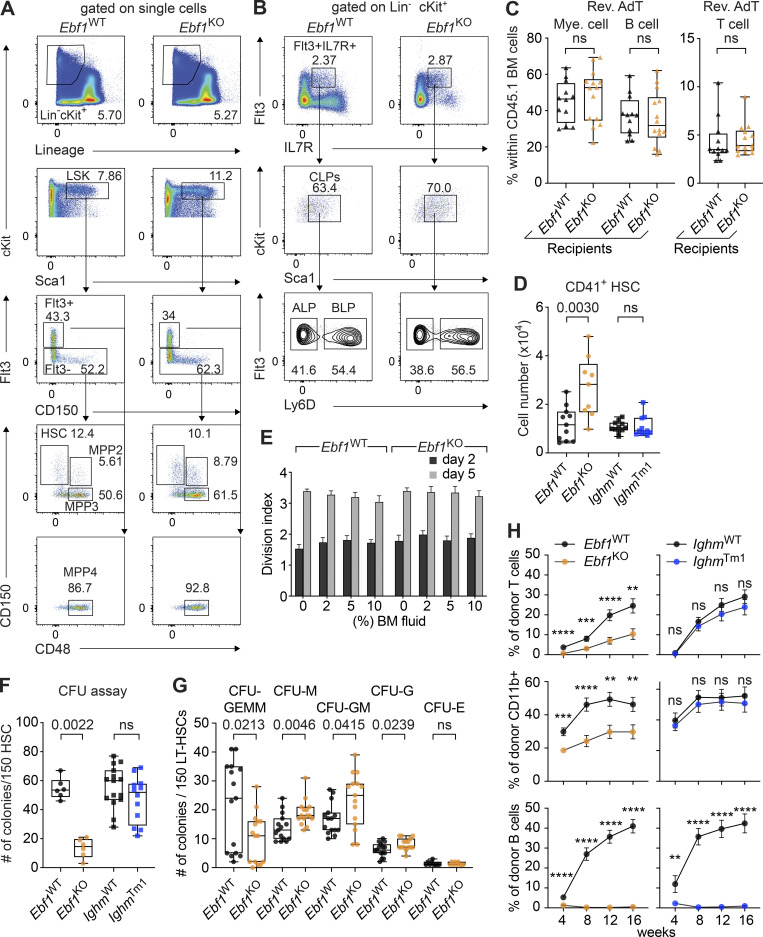
Extended characterization of HSC functionality upon Ebf1 deficiency. Related to Figs. 1 and 2. (A) Gating strategies for HSC, MPP2, MPP3, and MPP4 cells. (B) Gating strategies for CLP, ALP, and BLP cells. Representative plots are shown for Ebf1WT and Ebf1KO mice. (C) Frequencies of myeloid cells (CD11b+), B cells (CD19+), and T cells (CD4+ CD8+) within CD45.1 donor cells in the BM of the Ebf1WT and Ebf1KO recipients 16 wk after AdT. Ebf1WT n = 13, Ebf1KO n = 14. (D) Absolute number of CD41+ HSCs in the BM. Ebf1WT n = 11, Ebf1KO n = 9, IghmWT n = 11, and IghmTm1 n = 14. (E) 300 WT CTY-labeled HSCs were cultured in TPO and SCF, with increased concentrations of BM fluid collected from Ebf1WT and Ebf1KO mice. Division index (CTY mean fluorescence intensity [MFI] from day n/CTY MFI from day 0) at day 2 and day 5, of CTY-labeled HSCs cultured with different BM fluid concentrations from Ebf1WT and Ebf1KO mice, n = 6–8. (F) CFU assay performed with 150 sorted HSCs plated in triplicate in methocult. Total number of colonies formed after 10–12 d of plating. Biological replicates Ebf1WT and Ebf1KO n = 2, IghmWT and IghmTm1 n = 3. (G) CFU assay performed with 150 sorted LT-HSCs (LSK CD34−Flt3−CD150+CD48−) plated in triplicate in methocult. Colony identification after 10–12 d of plating. Biological replicates Ebf1WT and Ebf1KO n = 5. (H) Frequency of CD45.2 donor-derived cells in the peripheral blood within T cells (CD4+ CD8+; ****, P < 0.0001; ***, P = 0.0004; **, P = 0.0013), myeloid cells (CD11b+; ***, P = 0.0002; ****, P < 0.0001; **, P = 0.0010; **, P = 0.0024) and B cells (CD19+; **, P = 0.0060; ****, P < 0.0001), during the AdT. Data are represented as mean ± SEM. Ebf1WT n = 33 and Ebf1KO n = 40, IghmWT n = 17, and IghmTm1 n = 19. (C–H) Statistical significance was determined by Mann-Whitney U test. Data are from >2 independent experiments.

