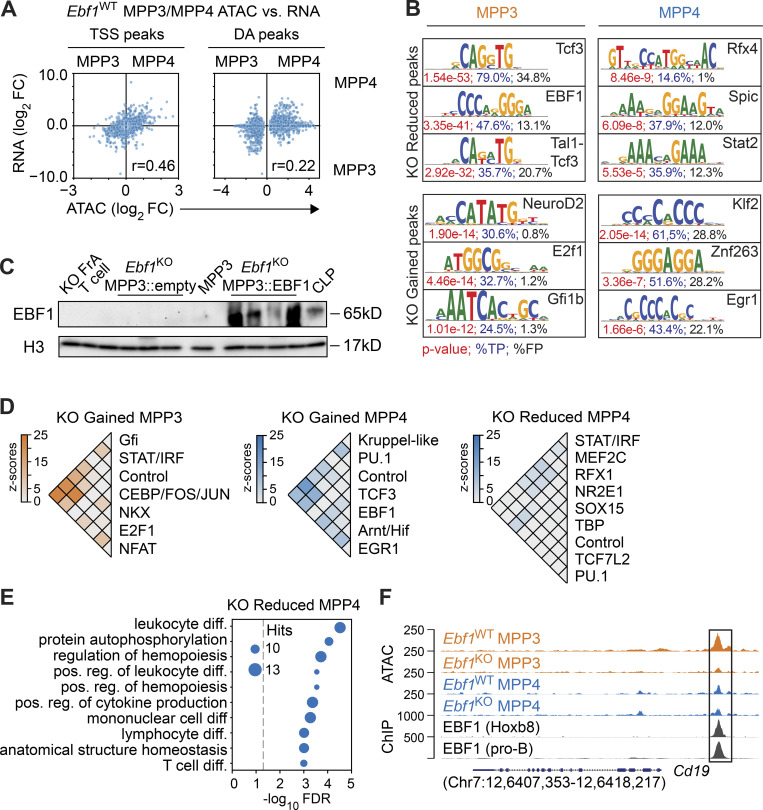
Figure S2.
Chromatin accessibility changes in Ebf1-deficient MPP3 and MPP4 cells. Related to Fig. 3. (A) Comparison of chromatin accessibility changes to gene expression changes in MPP3 versus MPP4 cells, in Ebf1WT conditions. The y axis represents log2 fold changes of gene expression, and the x axis represents log2 fold changes of peak read counts in MPP3 versus MPP4 cells in Ebf1WT conditions. Left: Dots represent ATAC peaks that overlap their TSS (TSS peaks). Right: Dots represent DA peaks between MPP3 versus MPP4 cells in Ebf1WT conditions. Biological replicates for RNA-seq n = 4. Biological replicates for ATAC-seq n = 2. (B) Sequence logos of top ranked enriched motifs underlying the DA peaks in MPP3 and MPP4 cells from Ebf1WT and Ebf1KO mice. P values are depicted in red, percentages in blue reflect the fraction of hits found in the peak set, percentages in black reflect the fraction of hits found in the background set. (C) Immunoblot analysis of EBF1 protein levels in total cell extracts of 150,000 FACS-sorted cells of lineage-negative GFP+ cells transduced with empty vector or EBF1 vector, biological replicates for ATAC-seq used in Fig. 3 D (n = 4). Ebf1WT MPP3 cells and CLPs (Lin−cKitintSca1intIL7R+Flt3+) were used a positive control. T (CD4+CD8+) cells and Ebf1KO Fr. A cells were used as a negative control. Histone H3 was used as a loading control. (D) Heatmaps of co-occurrence counts in KO Gained MPP3 peaks and KO Reduced and KO Gained MPP4 peaks of enriched motifs in these DA peak sets versus co-occurrence counts in all MPP3 and MPP4 peaks (1,000 replicates), respectively. Co-occurrence counts with z-scores >5 are displayed. (E) Enrichment analysis of genes associated with KO Reduced MPP4 peaks. (F) Genome tracks showing ATAC signal and EBF1 ChIP signal at B-lymphoid related KO Reduced MPP3 peaks annotated to the Cd19 gene. Original data from Li et al. (2018); Kucinski et al. (2020). Source data are available for this figure: SourceData FS2.

