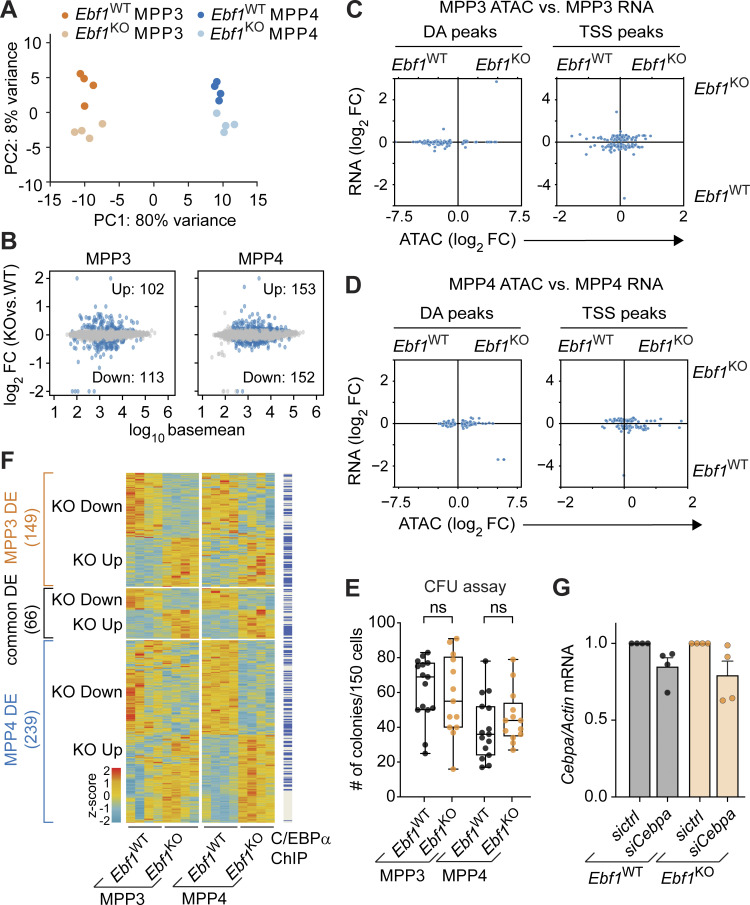
Figure S3.
Role of Ebf1 deficiency in myeloid-biased transcriptome. Related to Figs. 4 and 5. (A) PCA of bulk RNA-seq data from MPP3 and MPP4 cells of Ebf1WT and Ebf1KO conditions; based on DE genes. n = 4 biological replicates. (B) MA plots of MPP3 and MPP4 cells comparing Ebf1WT and Ebf1KO transcriptomes. Dots in blue represent genes with an FDR <0.1. The y axis represents shrunken log2 fold change (FC), capped at |log2 FC| 2, and the x axis represents log10 basemean. (C and D) Comparison of chromatin accessibility changes to gene expression changes in MPP3 (C) and MPP4 (D) cells upon Ebf1 deletion. The y axis represents shrunken log2 fold changes of gene expression and the x axis represents log2 fold changes of peak read counts in Ebf1WT versus Ebf1KO MPP4 cells. Left: Dots represent DA peaks in MPP3 (C) and MPP4 (D) cells. Right: Dots represent DE genes and ATAC peaks that overlap their TSS (TSS peaks). (E) CFU assay performed with 150 sorted MPP3 and MPP4 cells plated in triplicate in methocult. Total number of colonies formed after 10–12 d of plating. Biological replicates Ebf1WT and Ebf1KO n = 6. Statistical significance was determined by unpaired t test. (F) Heatmap showing gene expression of DE genes in MPP3 and MPP4 cells, between Ebf1WT and Ebf1KO conditions. Genes are organised into MPP3-specific, common, and MPP4-specific DE genes. Genes with an annotated C/EBPα ChIP peak (original data from Hasemann et al. [2014]; Pundhir et al. [2018]) are labeled in blue. Heatmap scale represents z-scores calculated separately for MPP3 and MPP4 cells. (G) qPCR analysis of Cebpa expression in Ebf1WT and Ebf1KO MPP3 cells transfected with a control or a Cebpa siRNA pool. Cebpa mRNA expression relative to Actb was normalized to the control transfected samples. Data are represented as mean ± SEM. Ebf1WT and Ebf1KO n = 4. (E and G) Data are from >2 independent experiments.

