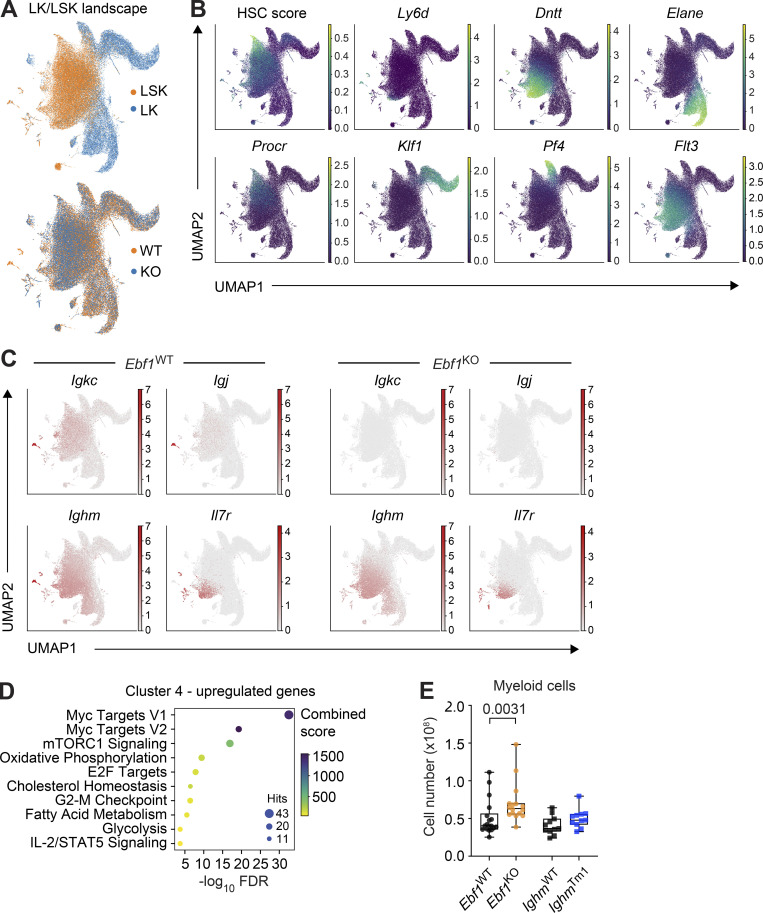
Figure S4.
Characterization of the scRNA-seq landscape in Ebf1WT and Ebf1KO LSK and LK cells. Related to Fig. 6. (A) scRNA-seq landscape derived from Ebf1WT and Ebf1KO LK and LSK populations, annotated for LSK and LK cells (top) and Ebf1WT and Ebf1KO cells (bottom). (B) UMAP visualisation of the HSC score and the expression of lineage marker genes used for the identification of cell clusters (Procr, Dntt, Elane, Klf1, Pf4, Flt3, Ly6d). (C) UMAP visualisation of the expression of Il7r and Ig genes in Ebf1WT and Ebf1KO cells. (D) GO enrichment analysis of the upregulated genes in cluster 4, between Ebf1WT and Ebf1KO cells. (E) Boxplots showing the absolute number of myeloid cells (CD11b+) in the BM. Ebf1WT n = 18, Ebf1KO n = 16, IghmWT and IghmTm1 n = 11. Statistical significance was determined by Mann-Whitney U test. Data are from >2 independent experiments.

