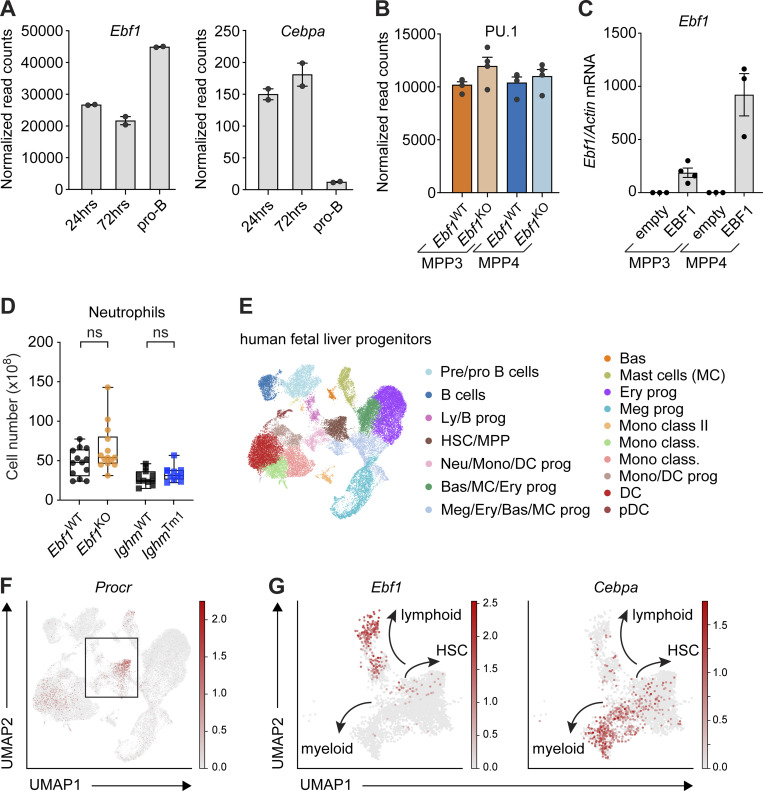
Figure S5.
Extended analysis of the Ebf1-Cebpa regulatory relationship. Related to Fig. 7. (A) Normalized read counts of Ebf1 (left) and Cebpa (right) in Ebf1 −/− pre-pro-B cells 24 and 72 h after EBF1 induction, and pro-B cells (original data from Li et al. [2018]). (B) Normalized read counts of Spi1 (PU.1) in MPP3 and MPP4 cells in Ebf1WT and Ebf1KO populations. (C) qRT-PCR analysis of Ebf1 expression in Ebf1WT MPP3 and MPP4 cells transduced with an empty or an EBF1 vector. Ebf1 mRNA expression relative to Actb was normalized to the empty vector transduced samples. Data are represented as mean ± SEM. Ebf1WT and Ebf1KO n = 3–4. (D) Boxplots showing the absolute number of neutrophils (Ly6G+) in the BM. Ebf1WT n = 13, Ebf1KO n = 14, IghmWT and IghmTm1 n = 11. Statistical significance was determined by Mann-Whitney U test. (C and D) Data are from >2 independent experiments. (E) Annotated UMAP projection of scRNA-seq landscape derived from human fetal liver progenitors. (F) UMAP visualization of the expression of Procr in human fetal liver progenitors. Box indicates selected clusters (HSC/MPP, Ly/B progenitors, and Neu/Mono/DC progenitors) shown in G. (G) UMAP visualization of the expression of Ebf1 and Cebpa in selected clusters of human fetal liver progenitors. (E–G) Original data from Popescu et al. (2019). Meg, megakaryocyte; Ery, erythrocyte; Bas, basophil; Neu, neutrophil; Mono, monocyte; DC, dendritic cell; Ly, lymphocyte; prog, progenitors; pDC, plasmacytoid DC.

