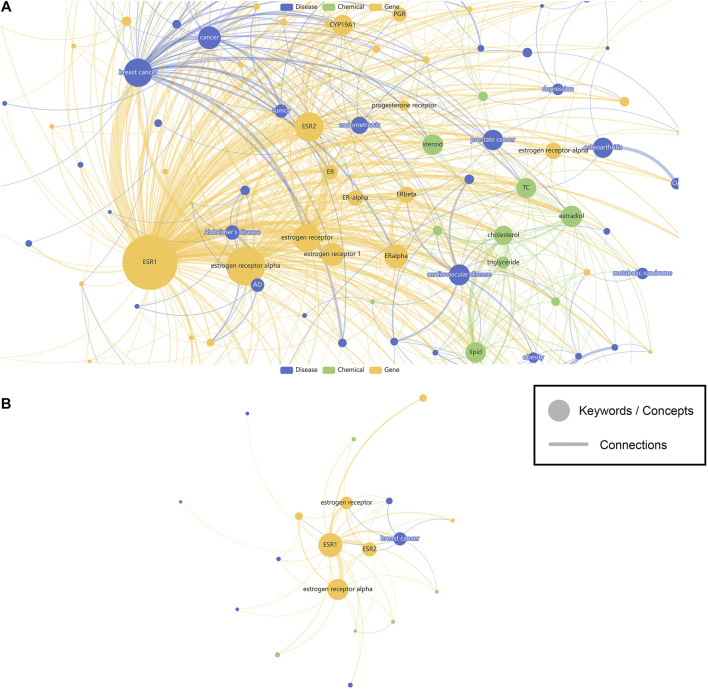
FIGURE 2.
The visualization of SNP associated keywords. (A) Show all keywords. (B) Show less keywords. Nodes represent keywords while edges represent connections. Sizes of the nodes represent the significance of keywords, while width of the edges represent the strength of connections. Colors of the nodes are assigned based on the different categories (genes, diseases, chemicals) of the keywords.

