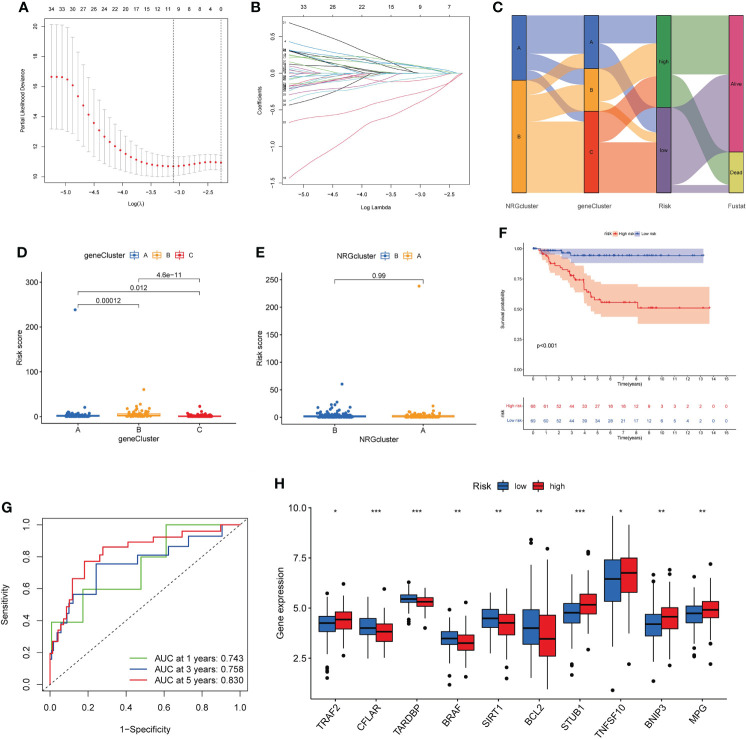
Figure 6.
Construction of necroptosis-related prognostic risk_score. (A, B). Lasso regression analysis on the prognosis-related genes. (C). Sankey diagram of samples distribution in two necroptosis subtypes, three gene subtypes and two risk_score groups. (D, E). Difference of risk_score among the three gene subtypes (D) and two necroptosis subtypes (E). (F). The Kaplan-Meier analysis for OS of two risk groups. (G). ROC curves to predict 1-, 3-, and 5-year OS according to the risk _score in the training cohort. (H). Expression of NRGs in two risk groups (t-test, “***”, P = 0.001; “**”: P = 0.01; “*”: P = 0.05). OS, overall survival; NRGs, necroptosis-related genes.

