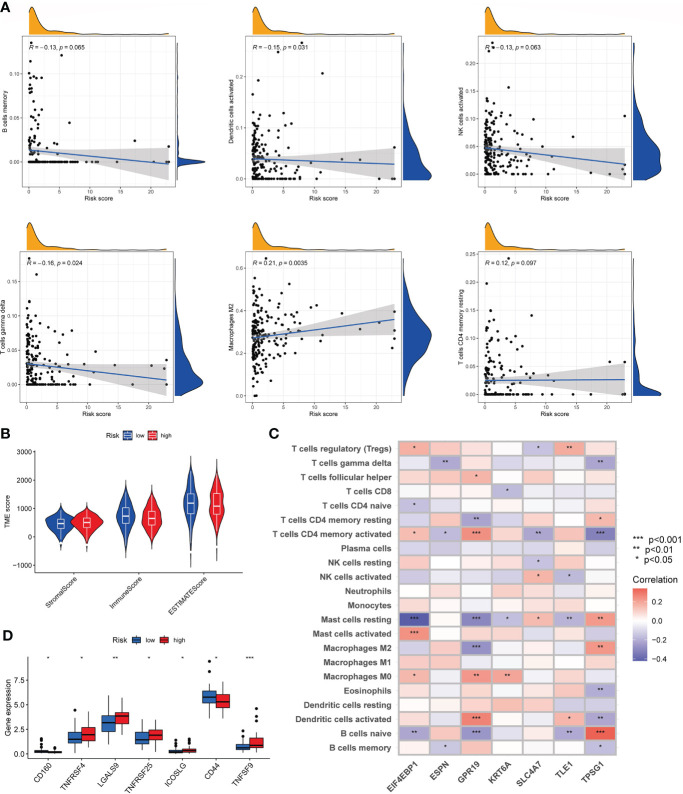
Figure 8.
Characteristics of the TME and immune checkpoint among two risk_score groups. (A). Association between risk_score and immune cell infiltration; (B). Association between risk _score and both immune and stromal scores. (C). Association between the abundance of immune cells and seven genes in the risk_score model. (D). Expression of immune checkpoints in the high and low-risk groups. TME, tumor microenvironment.

