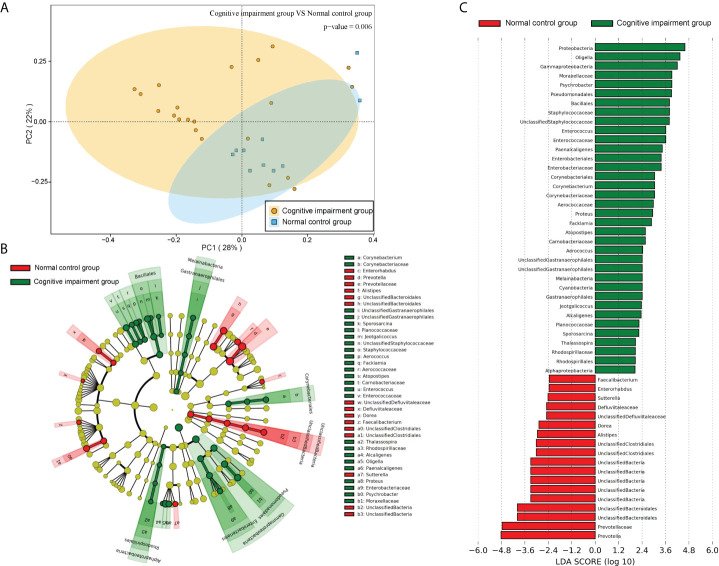
Figure 6.
The microbiota structures of fecal samples from the normal control group and the cognitive impairment group were compared. (A) The PCA result revealed a significant difference in gut bacterial structure between the two groups. The two principal component scores accounted for 28 (PC1) and 22% (PC2) of total variations, respectively. Each symbol represents an individual sample. (B, C) The dominant floras of the two groups were analyzed by LEfSe (Linear discriminant analysis Effect Size). (B)Taxonomic representation of statistically and biologically consistent differences between fecal samples from the normal control group and the cognitive impairment group. Differences are represented in the color of the most abundant class (red, the normal control group; green, the cognitive impairment group; yellow, non-significant). Each circle’s diameter is proportional to the taxon’s abundance. (C) Histogram of the LDA scores computed for features differentially abundant between the two groups. The LDA threshold is 2.0.

