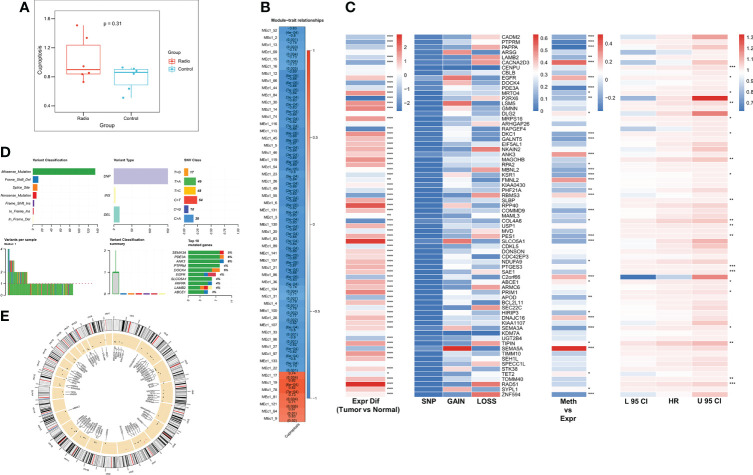
Figure 1.
Identification of radiotherapy-associated CRGs. (A) Box plot showing Cuproptosis pathway activity before and after radiotherapy. (B) Identification of the most relevant gene modules for Cuproptosis. (C) Heat map showing genomic changes and hazard ratios of CRGs in TCGA-LUAD. From left to right were respectively: expression differences of CRGs in tumor and normal samples, frequency of mutations and copy number variants of CRGs, correlation of DNA methylation modifications and expression of CRGs, and univariate Cox regression analysis showing risk ratios of CRGs. *p < 0.05, **p < 0.01, ***p < 0.001. (D) Summary of mutational events in CRGs in TCGA-LUAD. (E) Circle diagram demonstrating the CNV events of CRGs on chromosomes.

