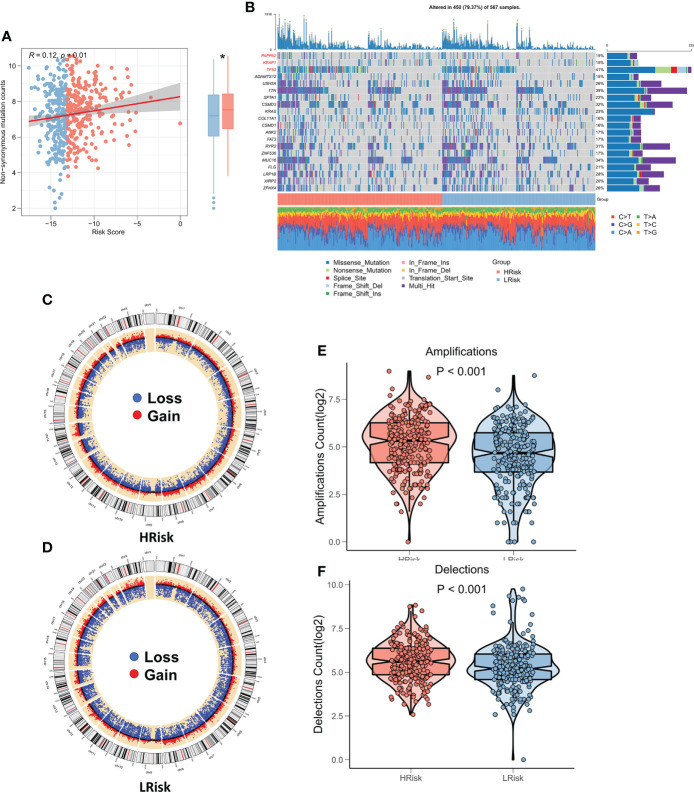
Figure 7.
Genomic variation landscape of CRGs-related deep learning models. (A) Box plot showing the difference in TMB among the two risk groups. (B) Oncoplot of significantly mutated genes between the two risk groups. (C) The loop diagram shows the CNV landscape in the high-risk group. (D) The loop diagram shows the CNV landscape in the low-risk group. (E) Box plots represent the variation in chromosome amplification numbers in the high-risk and low-risk groups. (F) Box plots display the variation in the number of chromosome deletions among the two risk groups. *P < 0.05.

