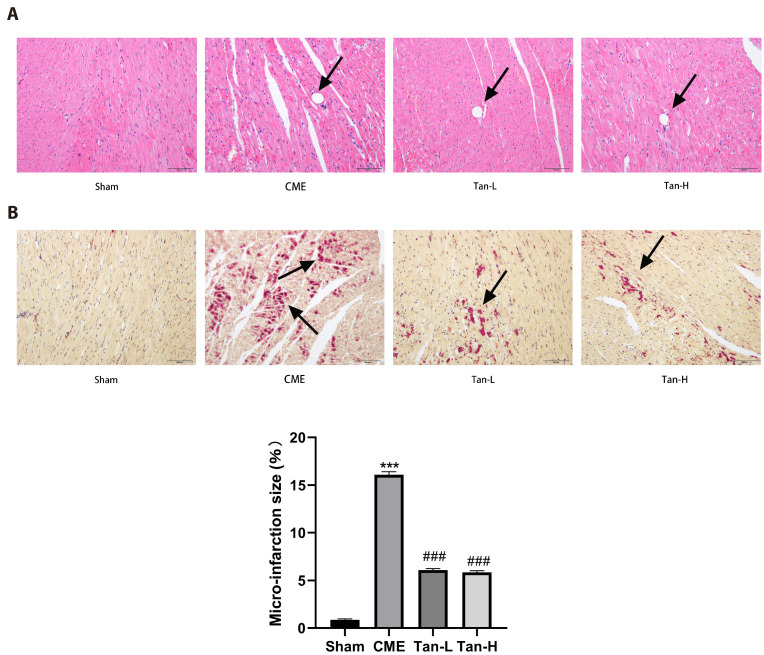
Fig. 3. Histopathological examination of myocardial tissues through hematoxylin and eosin (H&E) and hematoxylin basic fuchsin-picric acid (HBFP) staining (n = 8 for each group).
Scale bar = 100 μm. (A) H&E staining. Microspheres with inflammatory cell infiltration were observed in the CME, Tan-L, and Tan-H groups but not in the sham category. The black arrows indicate the microspheres. (B) HBFP staining. An ischemic myocardium is highlighted in red. The black arrows indicate the microinfarct area. CME, coronary microembolization; Tan-L, CME + low-dose Tan IIA (10 mg/kg); Tan-H, CME + high-dose Tan IIA (20 mg/kg). ***p < 0.001 vs. the sham group; ###p < 0.001 vs. the CME group.

