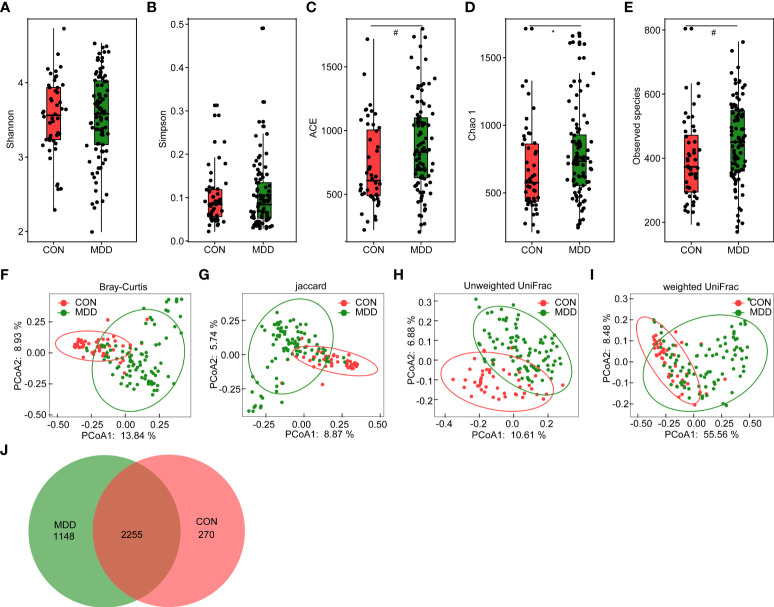
Figure 1.
Altered overall structure of the fecal microbiota in patients with childhood major depressive disorders (MDD). The diversity indices of Shannon (A) and Simpson (B), and the richness indices of ACE (C), Chao1 (D), and the observed OTUs (E) were used to evaluate the overall structure of the fecal microbiota in childhood MDD patients and the healthy controls. The data are presented as mean ± standard deviation. Unpaired t tests (two tailed) were used to analyze the variation between the groups. *p < 0.05 and #p < 0.01 compared with the control group. Principal coordinate analysis (PCoA) plots of individual fecal microbiota based on Bray–Curtis (F), jaccard (G), and unweighted (H) and weighted (I) UniFrac distances in childhood MDD patients and the healthy controls. Each symbol represents a sample. The Venn diagram illustrates the overlap of OTUs in childhood MDD-associated microbiota and healthy controls (J).

