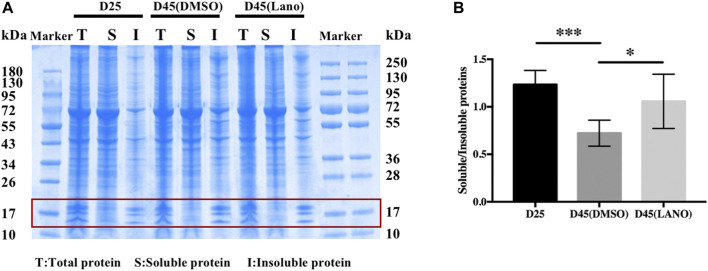
FIGURE 3.
Soluble and insoluble protein concentration determination of control and lanosterol treated LBs. (A) Concentration of soluble and insoluble proteins was detemined by SDS-PAGE gel electrophoresis combination with coomassie blue staining. (B) Quantitative analysis of bands around 20kd region (red box) showed that the increase of insoluble protein was less in the lanosterol treated LBs than the control LBs. Bars represent mean ± SD (n = 4). *p < .05, ***p < .001. T, total protein; S, soluble protein; I, insoluble protein. DMSO, dimethyl sulfoxide. Lano, lanosterol.

