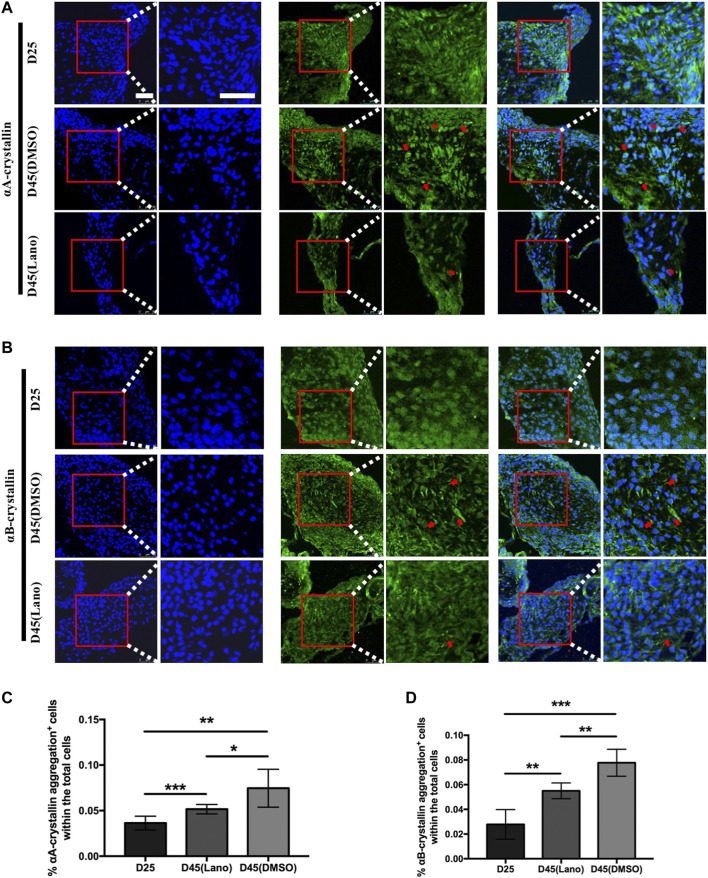
FIGURE 5.
Protein aggregation in control and lanosterol treated LBs in LB slices staining. (A,B) Similar with Figure 4, cells containing αA‐crystallin or αB‐crystallin protein aggregation (red arrows) were more abundant in control cloudy LBs on D45 compared with lanosterol treated LBs on D45, and ware nearly absent in all LBs on D25. (C,D) Quantification data showed that more cells containing protein aggregations were observed in control control LBs on D45 compared with control LBs on D25 and lanosterol treated LBs on D45. Bars represent mean ± SD. *p < .05, **p < .01, ***p < .001. Bar:50uM. DMSO, dimethyl sulfoxide. Lano, lanosterol.

