. 2022 Jun 22;31(9):1849–1857. doi: 10.1158/1055-9965.EPI-22-0114

Figure 3.

Figure 3. OC/OPC annual mortality rate, by cohort and year. Between 2012 and 2014, OC/OPC annual mortality rates in the Medicaid cohort decreased while rates among the commercial insurance cohort increased. In 2012, the mortality rate was 2.03% for Medicaid enrollees and 0.95% for commercial enrollees. By 2014, the gap between the two groups had narrowed slightly, showing a mortality rate of 1.92% and 1.07% for Medicaid and commercial enrollees, respectively. Beginning in 2016, there was a leveling off in mortality rate for Medicaid enrollees across the next four years, from 1.89% in 2016 to 1.86% in 2019.

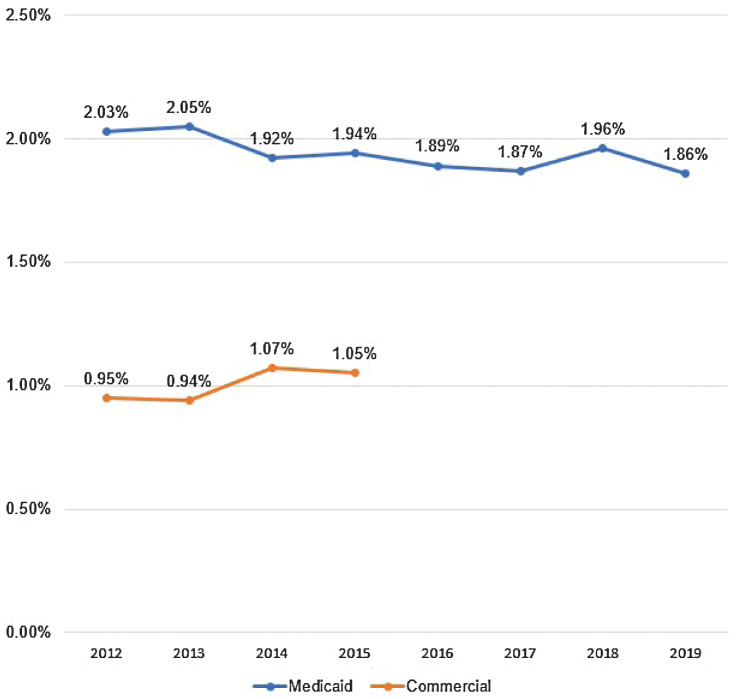
OC/OPC annual mortality rate, by cohort and year. Between 2012 and 2014, OC/OPC annual mortality rates in the Medicaid cohort decreased while rates among the commercial insurance cohort increased. In 2012, the mortality rate was 2.03% for Medicaid enrollees and 0.95% for commercial enrollees. By 2014, the gap between the two groups had narrowed slightly, showing a mortality rate of 1.92% and 1.07% for Medicaid and commercial enrollees, respectively. Beginning in 2016, there was a leveling off in mortality rate for Medicaid enrollees across the next four years, from 1.89% in 2016 to 1.86% in 2019.