Figure 3.
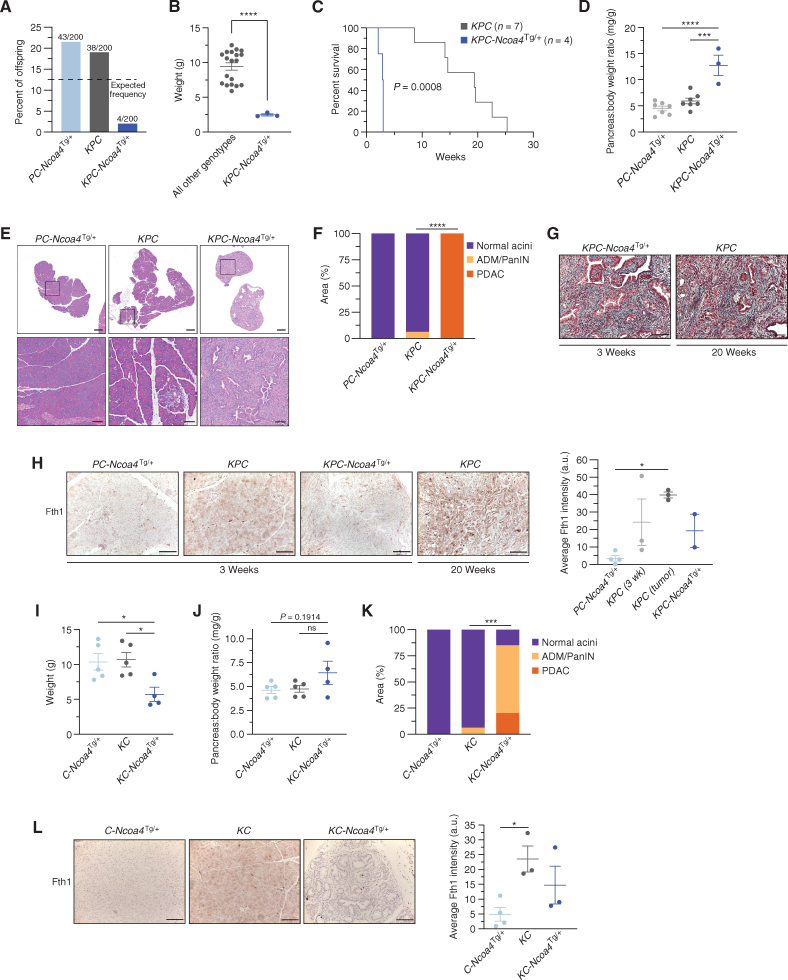
Enhanced NCOA4-mediated ferritinophagy accelerates PDAC initiation and worsens murine survival. A, Genotype frequency of Trp53fl/+; Pft1a-Cre; Ncoa4Tg/+ (PC-Ncoa4Tg/+), KrasLSL-G12D/+; Trp53fl/+; Pft1a-Cre (KPC), and KrasLSL-G12D/+; Trp53fl/+; Pft1a-Cre; Ncoa4Tg/+ (KPC-Ncoa4Tg/+) among 200 genotyped offspring mice; dotted line represents expected frequency of genotypes (12.5%). B, Body weight of KPC-Ncoa4Tg/+ mice versus mice of all other genotypes measured at 3 weeks of age. C, Kaplan–Meier analysis comparing overall survival of KPC-Ncoa4Tg/+ (n = 4) versus KPC (n = 7) mice. Log-rank test, P = 0.0008. D, Pancreas–to–body weight ratio of PC-Ncoa4Tg/+, KPC, and KPC-Ncoa4Tg/+ mice. E, Hematoxylin and eosin staining of representative pancreata from PC-Ncoa4Tg/+, KPC, and KPC-Ncoa4Tg/+ mice harvested at 3 weeks of age. Bottom row panels are magnifications of top row images. Top row scale bars = 500 μm. Bottom row scale bars = 100 μm. F, Quantification of normal acinar, acinar-to-ductal metaplasia (ADM)/PanIN, and PDAC area in PC-Ncoa4Tg/+ (n = 2), KPC (n = 4), and KPC-Ncoa4Tg/+ (n = 2) mice harvested at 3 to 4 weeks of age. G, Trichrome staining of representative PDAC tumors from a 3-week-old KPC-Ncoa4Tg/+ mouse and a 20-week-old tumor-bearing KPC mouse. H, Fth1 immunostaining of pancreata from PC-Ncoa4Tg/+, KPC, and KPC-Ncoa4Tg/+ mice at 3 to 4 weeks of age and tumor-bearing KPC mice. Scale bars, 50 μm. Quantification of average intensity in arbitrary units (a.u.; 5 random fields per sample; n = 2–4 mice/group; error bars, SEM). I, Body weight of C-Ncoa4Tg/+ (n = 5), KC (n = 5), and KC-Ncoa4Tg/+ (n = 4) mice measured at 3 weeks of age. J, Pancreas–to–body weight ratio of C-Ncoa4Tg/+ (n = 5), KC (n = 5), and KC-Ncoa4Tg/+ (n = 4) mice measured at 3 weeks of age. K, Quantification of normal acinar, ADM/PanIN, and PDAC area in C-Ncoa4Tg/+ (n = 5), KC (n = 6), and KC-Ncoa4Tg/+ (n = 3) mice harvested at 3 to 4 weeks of age. L, Fth1 immunostaining of pancreata from C-Ncoa4Tg/+, KC, and KC-Ncoa4Tg/+ mice at 3 to 4 weeks of age. Scale bars = 50 μm. Quantification of average intensity in arbitrary units (5 random fields per sample; n = 3–4 mice/group; error bars, SEM). For B, F, and K, significance was determined with the t test. ***, P < 0.001; ****, P < 0.0001. Error bars ± SEM. For D, H–J, and L, significance was determined using ANOVA. ns = not significant: P > 0.05; *, P < 0.05; ***, P < 0.001; ****, P < 0.0001. Error bars ± SEM.

