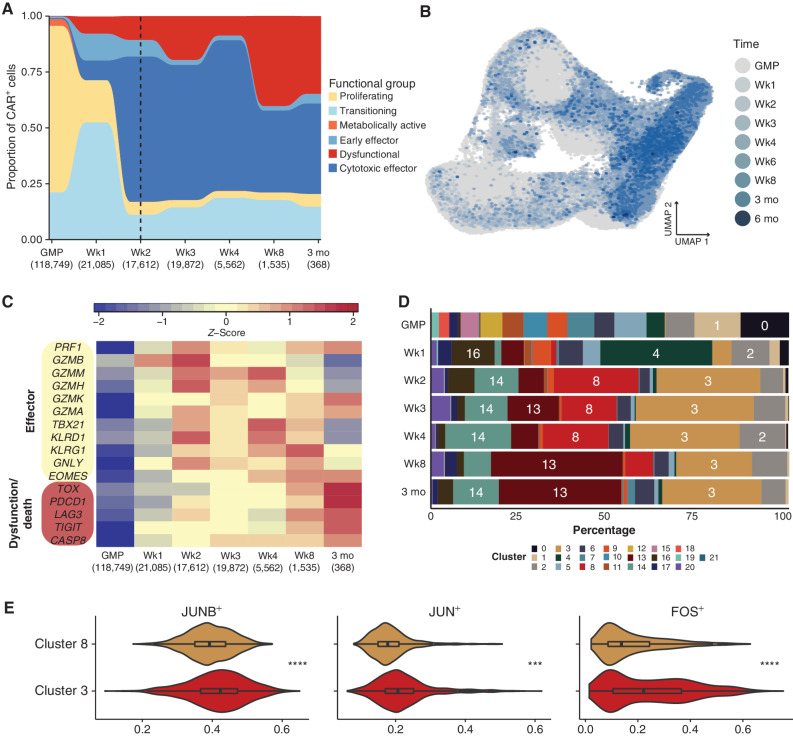
Figure 2.
Expression of effector and dysfunctional genes over time correlates with kinetics of CAR T-cell subsets. A, Relative proportion of functional groups as defined in Fig. 1, aggregated across donors for each preinfusion and postinfusion time point. The number of cells per time point is included in parentheses under each time point label. The six-month time point was excluded due to the limited number of CAR T cells (n = 7, from a single patient). A dashed vertical line indicates the median time point of peak expansion across sequenced patients. B, UMAP of pre- and postinfusion CAR T cells, colored by GMP status or postinfusion time point. Cells from later time points were plotted on top of those from earlier time points. C, Heatmap of average gene expression across CAR T-cell time points, visualizing variation in genes associated with cytotoxic effector function or T-cell dysfunction as indicated. D, Stacked bar plots portraying each transcriptional cluster's relative contribution to the indicated time points, colored by transcriptional cluster. E, Violin plots depicting activity level of select regulons that were significantly different between transcriptional clusters 3 and 8. Asterisks indicate the degree of significance. ****, Padj < 1E−15; ***, Padj < 1E−10 (>1E−15); **, Padj < 1E−5 (>1E−10); *, Padj < 0.05 (>1E−5).

