Fig. 4.
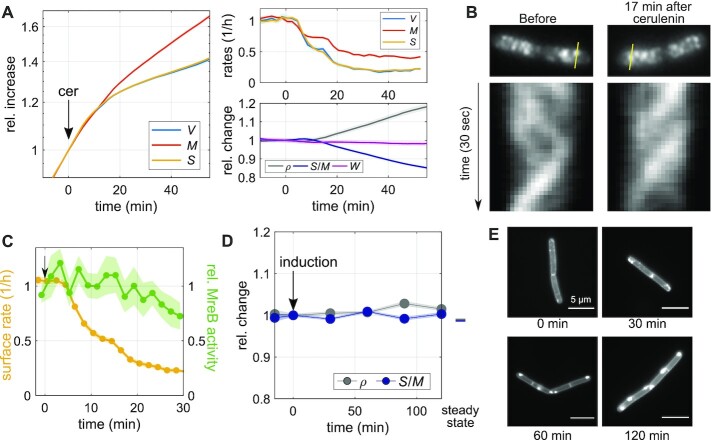
Inhibition of membrane synthesis decouples surface expansion and mass growth independently of peptidoglycan synthesis. (A) Single-cell time lapse of filamenting cells (bAB56) grown in S750+GlcCaa and treated with cerulenin 100 μg/ml (added to the agarose pad at time = 0). Relative increase (left) and rates (top right) of volume, surface area, and dry mass. Relative change (bottom right) of dry-mass density, surface-to-mass ratio, and width. (Solid lines + shadings = average ± 2*SE) (B) Kymographs of MreB-GFP rotation in filamenting cells (bYS19) during 30 s movie before and 17 min after cerulenin addition along the lines indicated in MreB-GFP snapshots (top). (C) Comparison of surface expansion rate (yellow; as in A) and relative MreB activity (green line + shading = average ± SE) of cerulenin-treated cells to that of nonperturbed cells, similar to Fig. 3(D). (D) Relative change of average dry-mass density and surface-to-mass ratio upon overexpression of AccDA (bSW305: amyE::pXyl-accDA) by addition of xylose (10 mM) at time = 0 in LB medium (average ± SE). Every point represents the average obtained from snapshots of batch-culture-grown cells. (E) AccDA overexpression in bSW305 (the same experiment in D) leads to the accumulation of excess membrane according to staining with the membrane dye MitoTracker green.

